It’s not too late! If you’re thinking about planting some fresh veggies but haven’t started yet, you still have time to get things in the ground for a late summer/early fall harvest. On average, the Puget Sound’s frost-free growing season is mid-March through mid-November, so with a little knowledge of when and how to start things, you can still see a bountiful harvest this year.
Some plants can be direct seeded into your garden, while others should be started indoors before being transplanted to your garden space. Deciding what to grow is the fun part! Plant what you like to eat, keeping in mind that some plants do better in our area than others.
Broccoli is arguably one of the most productive veggies you can grow in this area, although it can be vulnerable to root maggots and aphids. Giant Italian Parsley is easy to grow, highly productive, and expensive in the grocery store. Leeks are another that can be costly to buy in the store but trouble-free to grow in your own small space. Chard, Kale, Lettuce and Arugula are all full of vitamins and great for Northwest gardens. Carrots, Snap Peas, Snap Beans, Tomatoes and Basil all taste amazing fresh from the garden and grow relatively well in this area.
Check out the great resources at Garden.org for a full list of when to plant all these vegetables and more. They have detailed timelines for both spring and fall gardening; as well as information on transplanting seedlings vs. direct-sowing seeds.
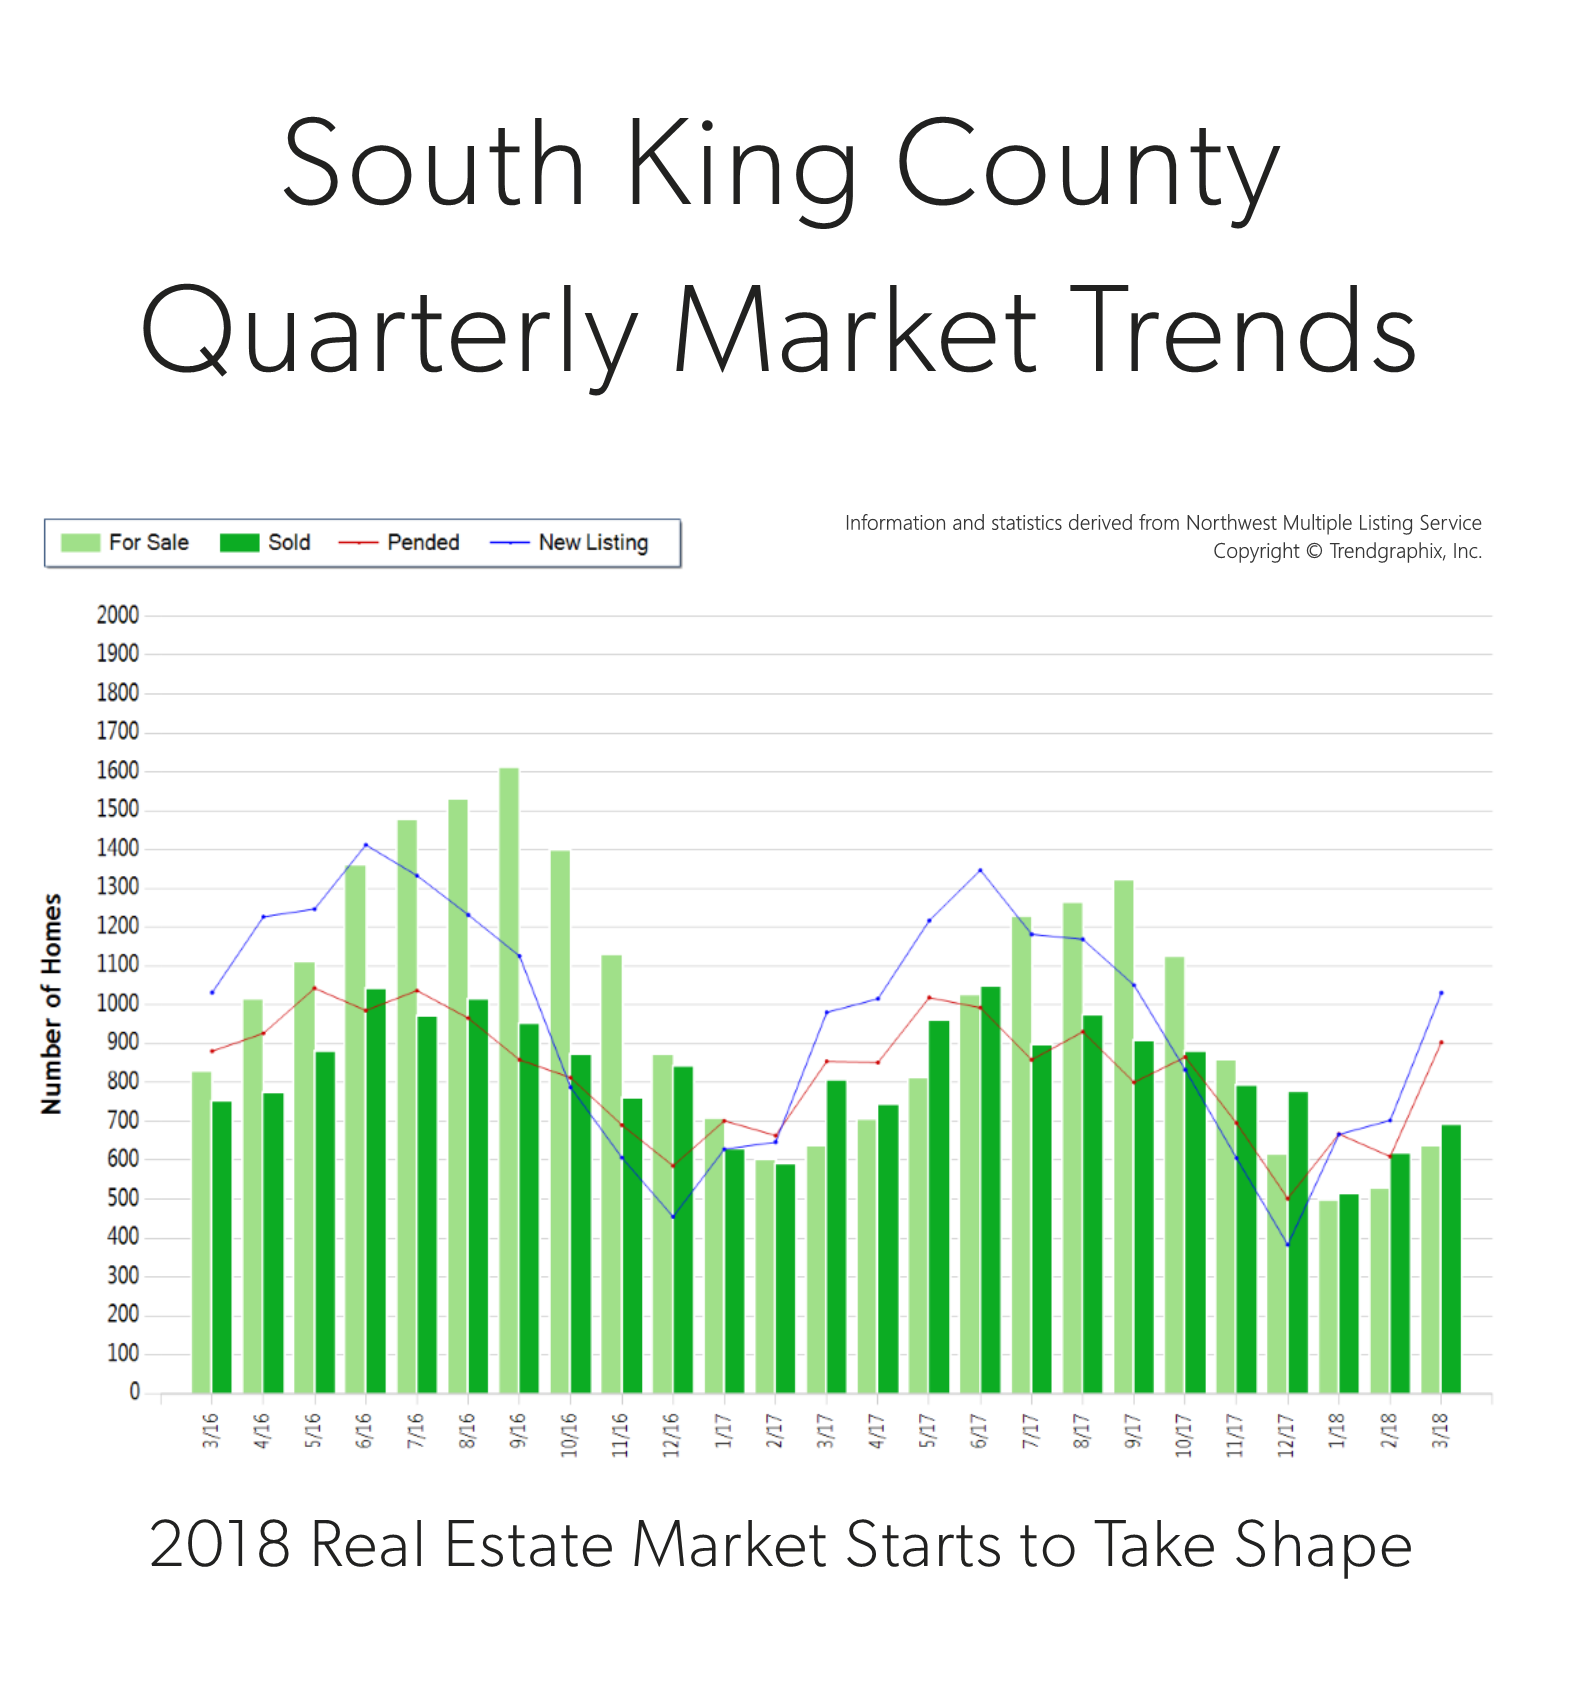
It is the time of year when our market starts to take off. Spring is here and we are starting to see seasonal increases in inventory. In fact, there was a 47% increase in new listings in March compared to February. That increase was matched by a 48% rise in pending sales, illustrating very strong demand for housing in your area. Last month, the average list-to-sale price ratio (the amount the sale price topped the list price) was 101%, indicating that multiple offers were the norm. We ended the quarter with 0.7 months of inventory – the lowest level yet. More inventory would be absorbed by happy buyers looking for more selection and would help temper price growth, which is up 12% year-over-year.
South King County real estate has been a hot spot due to reasonable commute times and overall affordability compared to “in-city” real estate. In fact, the median price in March was 78% higher in Seattle Metro. Sellers are enjoying amazing returns due to this phenomenon, and buyers are securing mortgages with minor debt service due to low interest rates. This is a very strong seller’s market, but buyers who are securing a home are already enjoying appreciation in equity.
This is only a snapshot of the trends in south King County; please contact me if you would like further explanation of how the latest trends relate to you.
It is the time of year when our market starts to take off. Spring is here and we are starting to see seasonal increases in inventory. In fact, there was a 54% increase in new listings in March compared to February. That increase was topped by a 58% rise in pending sales, illustrating very strong demand for housing in your area. Last month, the average list-to-sale price ratio (the amount the sale price topped the list price) was 103%, indicating that multiple offers were the norm. We ended the quarter with 0.7 months of inventory – the lowest level yet. More inventory would be absorbed by happy buyers looking for more selection and would help temper price growth, which is up 14% year-over-year.
Eastside real estate has a very high premium due to close-in commute times and desirable neighborhoods. In fact, the median price in March was $927,000! Sellers are enjoying amazing returns due to this phenomenon, and buyers are securing mortgages with minor debt service due to low interest rates. This is a very strong seller’s market, but buyers who are securing a home are already enjoying appreciation in equity.
This is only a snapshot of the trends on the Eastside area; please contact me if you would like further explanation of how the latest trends relate to you.
It is the time of year when our market starts to take off. Spring is here and we are starting to see seasonal increases in inventory. In fact, there was a 69% increase in new listings in March compared to February. That increase was followed by a 48% rise in pending sales, illustrating very strong demand for housing in your area. Last month, the average list-to-sale price ratio (the amount the sale price topped the list price) was 105%, indicating that multiple offers were the norm. We ended the quarter with 0.6 months of inventory based on pending sales. More inventory would be absorbed by happy buyers looking for more selection and would help temper price growth, which is up 16% year-over-year.
Seattle Metro real estate has a very high premium due to close-in commute times and vibrant neighborhoods. In fact, the median price in March was $800,000, up 5% from the month prior! Sellers are enjoying amazing returns due to this phenomenon, and buyers are securing mortgages with minor debt service due to low interest rates. This is a very strong seller’s market, but buyers who are securing a home are already enjoying appreciation in equity.
This is only a snapshot of the trends in the Seattle Metro area; please contact me if you would like further explanation of how the latest trends relate to you.
It is the time of year when our market starts to take off. Spring is here and we are starting to see seasonal increases in inventory. In fact, there was a 55% increase in new listings in March compared to February. That increase was followed by a 41% rise in pending sales, illustrating very strong demand for housing in your area. Last month, the average list-to-sale price ratio (the amount the sale price topped the list price) was 106%, indicating that multiple offers were the norm. We ended the quarter with 0.6 months of inventory based on pending sales. More inventory would be absorbed by happy buyers looking for more selection and would help temper price growth, which is up 14% year-over-year.
North King County real estate has a very high premium due to close-in commute times and desirable neighborhoods. In fact, the median price in March was $808,000, up 4% from the month prior! Sellers are enjoying amazing returns due to this phenomenon, and buyers are securing mortgages with minor debt service due to low interest rates. This is a very strong seller’s market, but buyers who are securing a home are already enjoying appreciation in equity.
This is only a snapshot of the trends in north King County; please contact me if you would like further explanation of how the latest trends relate to you.
It is the time of year when our market starts to take off. Spring is here and we are starting to see seasonal increases in inventory. In fact, there was a 47% increase in new listings in March compared to February. That increase was matched by a 48% rise in pending sales, illustrating very strong demand for housing in your area. Last month, the average list-to-sale price ratio (the amount the sale price topped the list price) was 103%, indicating that multiple offers were the norm. We ended the quarter with 0.5 months of inventory – the lowest level yet. More inventory would be absorbed by happy buyers looking for more selection and would help temper price growth, which is up 15% year-over-year.
South Snohomish County real estate has been a hot spot due to reasonable commute times and overall affordability compared to “in-city” real estate. In fact, the median price in March was 47% higher in Seattle Metro. Sellers are enjoying amazing returns due to this phenomenon, and buyers are securing mortgages with minor debt service due to low interest rates. This is a very strong seller’s market, but buyers who are securing a home are already enjoying appreciation in equity.
This is only a snapshot of the trends in south Snohomish County; please contact me if you would like further explanation of how the latest trends relate to you.
It is the time of year when our market starts to take off. Spring is here and we are starting to see seasonal increases in inventory. In fact, there was a 54% increase in new listings in March compared to February. That increase was matched by a 50% rise in pending sales, illustrating very strong demand for housing in your area. Last month, the average list-to-sale price ratio was 100%, and average days on market was 35 days. We ended the quarter with 0.7 months of inventory – the lowest level yet. More inventory would be absorbed by happy buyers looking for more selection and would help temper price growth, which is up 12% year-over-year.
North Snohomish County is one of the most affordable markets in the area. In fact, the median price in March was 28% higher in south Snohomish County. Buyers are migrating to the area, especially if they don’t have to commute into the city. Sellers are enjoying amazing returns due to this phenomenon, and buyers are securing mortgages with minor debt service due to low interest rates. This is a very strong seller’s market, but buyers who are securing a home are already enjoying appreciation in equity.
This is only a snapshot of the trends in north Snohomish County; please contact me if you would like further explanation of how the latest trends relate to you.
Since 2014, home values have grown by over 10% each year, resulting in a resounding 35% or more return in pricing. Above are some examples of actual homes sold in late 2017 to early 2018 that also sold in 2014, and that were not remodeled or significantly improved in between sales. These examples show the growth in home values that we have experienced over the last three years due to our thriving local economy. I pulled these examples to show you actual pound-for-pound market data versus the statistical percentages I often quote in these market updates. I thought these examples were pretty telling and quite exciting.
This phenomenon has been driven by a lack of available housing inventory and super high demand due to the robust job market in our area influenced by companies like Amazon. In 2017, there were 1,000 people moving into our area each week! According to census data, that trend is supposed to continue.
The large price gains might seem familiar to the gains of the previous up market of 2004-2007 that resulted in a bubble, but this environment is much different, which is why we are not headed toward a housing collapse. Previous lending practices allowed people to get into homes with risky debt-to-income ratios, low credit scores, and undocumented incomes. A large part of why the housing bubble burst 10 years ago was due to people getting into mortgages they were not equipped to handle, which lend to the eventual fall of sub-prime lending and the bubble bursting. Matthew Gardner, Windermere’s Chief Economist speaks to this topic in this video.
It is supply and demand that is creating these huge gains in prices. An increase in inventory would be healthy and would temper price growth. Many folks who have been waiting for their current home values to return in order to make big moves involving their retirement, upgrading homes, investing, or even buying a second home are well poised to enter the market. If you are one of those people, I hope these examples provide insight on the increase in home values and how they might pertain to your goals.
Potential buyers might shy away from the market due to affordability. While it is expensive to buy a home in the Greater Seattle area, the people that have become homeowners over the last three years have built some amazing wealth. Interest rates remain low, helping to absorb the cost of a home in our area. Last month, I wrote a Love Letter to Buyers which helped layout the advantages of participating in today’s market and how to be successful. If you or any one you know is considering making a purchase, it is worth the read.
As we head into the active spring and summer months, if you’d like me to provide you a complimentary Comparable Market Analysis (CMA) on your home, so you have a better understanding of your home’s value, I’d be happy to do that. This would be an important component in charting your 2018 financial goals, and what a great time of year to gather that information! It is my goal to help keep my clients informed and empower strong decisions.
Celebrate Earth Day with us! Bring all your sensitive documents to be professionally destroyed on-site by Confidential Data Disposal. Limit 20 file boxes per customer.
We will also be collecting non-perishable food and cash donations to benefit Concern for Neighbors Food Bank. Donations are not required, but are appreciated.
*This is a shredding-only event. Only paper will be accepted – no electronics or recyclables.
Spring Gardening Tips to Help Get Your Yard Flourish-Ready
It is approaching that time of year when April showers will start to bring May flowers, so no better time to get outside to start prepping the garden. First, one must get their hands dirty cleaning out the beds, tending the soil and trimming back plants to prepare for new plantings and fresh growth. For a complete list of Spring gardening tips, click here.
I am commonly asked which improvements sellers should make to get the greatest return on their home sale. Every year The Remodeling 2018 Cost vs. Value Report (www.costvsvalue.com) compiles all the information and analyzes the estimated percentage return on home improvements in each region. Getting a home prepared for market requires a keen eye and great resources. To access the entire Cost vs. Value report please visit www.costvsvalue.com and follow the steps to locate the Seattle area report.
Also, I have a great list of reputable contractors from HVAC to plumbing to roofing who are licensed and bonded in the State of Washington. Please call on me whenever you need a solid recommendation. I am happy to help whether you are getting your home ready for market or just want to find a good window washer now that the sun is starting to shine a little more.
Complete data from the Remodeling 2018 Cost vs. Value Report can be downloaded free at www.costvsvalue.com
I hope your Valentine’s Day was a sweet one, but it got me thinking. I am often sharing with you the advantages of this market for home sellers, which is unbelievably positive. With that said, I thought I’d take some time to give the potential buyers in our marketplace some love, hope, and of course, data!
Dear Greater Seattle Home Buyer,
Let’s just be up front: buying a home in today’s market is not easy. Quite frankly, it can be a wild roller coaster ride with twists and turns; but remember, folks pay a lot of money and stand in long lines for roller coaster rides. Imagine the excited pit in your stomach as the cart clicks up to the highest point before you plunge down a steep drop, and the thrill of raising your hands up because you trust that you are going to be okay. These emotions also accurately reflect the feelings of today’s home buyer – it can be a wild ride! Let’s also note that many roller coaster riders return to the back of the line right after getting off. Home ownership is also a good exercise to repeat and is often the investment that leads to the most built wealth in one’s life.
So how does one ensure that they are not the Nervous Nelly who stands in line for over an hour, finally makes it to the front to be strapped in to the cart, but who then chooses to bow out? The one that sits on the sidelines watching others throw up their hands with a thrill in their eye; the one with that tinge of regret as their friends rejoin them back on hallowed ground to recount their adventure. Wow, this is getting dramatic! Here are a few tips to follow that will ensure that one can find success securing a home in today’s market and get on the equity building train.
Waiting is Even More Expensive
In 2017, the year-over-year median price gains across our region were strong. In fact, here is a little break down.
North Snohomish County:
$371,000
up 13%
South Snohomish County:
$508,000
up 14%
North King County:
$715,000
up 14%
Seattle Metro:
$710,000
up 15%
South King County:
$405,000
up 13%
Eastside:
$865,000
up 15%
The appreciation is for real and as each month ticks by, prices are going up. That is why it is incredibly important to have a plan and realistic expectations. In referring to the chart above, it is plain to see the affordability of each area. Buyers have had to get creative and honest with themselves regarding the city or neighborhood in which they land. Commute times are one of the biggest indicators of home cost. It is paramount to line your budget up with a realistic commute time and then dig in. Too often I’ve seen buyers tightly grip to the idea of an in-city commute, only to have it end up being a more suburban choice in the end. The months wasted trying to perform in a market that didn’t match their budget ended up costing them at least 1% a month, based on last year’s appreciation. Getting real saves time, money, and heartache.
Interest Rates are a’Rising
This aspect is actually one to pay very close attention to. We have been amazingly spoiled with historically low interest rates over the last five years. In fact, there is an entire generation of buyers who only know rates that have hovered from 3.5 – 4.5% – that is close to 3 points under the 30-year average! A good rule of thumb regarding interest rates, is that for each 1-point increase a buyer loses 10% of their buying power. That means that if you have a $500,000 budget and the rate goes up by a point, that you are now shopping for a $450,000 house if you want the same payment. Note, that shift does not take appreciation into consideration. Today’s rates have helped buyers bear the home prices in our area. It is predicted that rates will rise in 2018 by .5 to 1%.
Rents are High and Don’t Build Wealth
Seattle is now the 5th most expensive city to rent in the country according to the US Census Bureau. With rising rental rates, still historically low interest rates, and home prices on the rise, the advantage of buying versus renting has become clear for folks who have a down payment saved, good debt-to-income ratios and strong credit. Currently, the breakeven horizon (the amount of time you need to own your home in order for owning to be a superior financial decision vs. renting) in the Greater Seattle area is 1.6 years according to Zillow research.
Partner with a Broker Who Will Get the Job Done
A broker that has a process is key! It starts with an initial buyer consultation. I liken the buyer consultation to the seat belt you would wear on the roller coaster ride. When you go to the Dr. they start with your intake, check your vitals, ask questions, etc. The buyer consultation aims to unearth a buyer’s goals, research the areas they are interested in, address financing, and illustrate the challenges of the environment, so one can be successful. Time is money, and this consultation brings clarity, efficiency and trust. This upfront education coupled with a high level of communication and availability is paramount. The depth of the relationship will lead to success, and is the ingredient that enables a buyer to throw up their hands and take the thrilling plunge. It is hard to do that without a seat belt!
Get Your Finances in Order
Aligning with a trusted real estate professional is key, but so is aligning with a reputable and responsive mortgage lender. Getting pre-approved is the minimum, but getting pre-underwritten is a game changer. Finding a lender that is willing to put in the work up-front to vet credit, income, savings, debt, and all other financial indicators will lead to being pre-underwritten, which listing agents and sellers appreciate! Also, be aware that you do not always need to have a huge down payment to make a purchase work. Employment, assets, credit, and what you have saved all work into your ability to acquire a loan. I have seen plenty of people secure a home with 3-5% down. Education and awareness create clarity, and investing into understanding your financial footing equals empowered and more efficient decisions. Note that I mentioned “responsive”. This is a 24/7 market, and lenders who don’t work evenings and weekends can get in the way of a buyer securing a home. If you need a short list of lenders that fit this description, please contact me.
‘Tis the Season – Inventory is Coming
Have hope! This is the time of year where we see inventory climb month over month. There will be more selection, but bear in mind it is also the time of year that the appreciation push happens. If you are feeling 75-80% in love with a home, it is one to act on. You’re never going to “get it all”, so a willingness to focus on priorities will pay off, because waiting will have an expense.
If you or someone you know is considering a purchase in today’s market, please contact me. It is my pleasure to take the time to educate, devise a plan, and help buyers find success in a challenging, yet advantageous market.
Celebrate Earth Day with us! Bring all your sensitive documents to be professionally destroyed on-site by Confidential Data Disposal. Limit 20 file boxes per customer.
We will also be collecting non-perishable food and cash donations to benefit Concern for Neighbors Food Bank. Donations are not required, but are appreciated.
*This is a shredding-only event. Only paper will be accepted – no electronics or recyclables.
We are so fortunate here at Windermere to have Matthew Gardner help keep us informed on our economy and the real estate market. Each quarter Matthew compiles in-depth research on counties from across Western Washington. Click here to download Matthew’s full Q4 2017 report. Also, I recently hosted Matthew’s 2018 economic forecast for the Greater Seattle area and had it professionally recorded. If you are interested in receiving access to view the entire presentation, please contact me and I’ll send it to you.

 Facebook
 X
X
 Pinterest
 Copy Link


 It is the time of year when our market starts to take off. Spring is here and we are starting to see seasonal increases in inventory. In fact, there was a 47% increase in new listings in March compared to February. That increase was matched by a 48% rise in pending sales, illustrating very strong demand for housing in your area. Last month, the average list-to-sale price ratio (the amount the sale price topped the list price) was 101%, indicating that multiple offers were the norm. We ended the quarter with 0.7 months of inventory – the lowest level yet. More inventory would be absorbed by happy buyers looking for more selection and would help temper price growth, which is up 12% year-over-year.
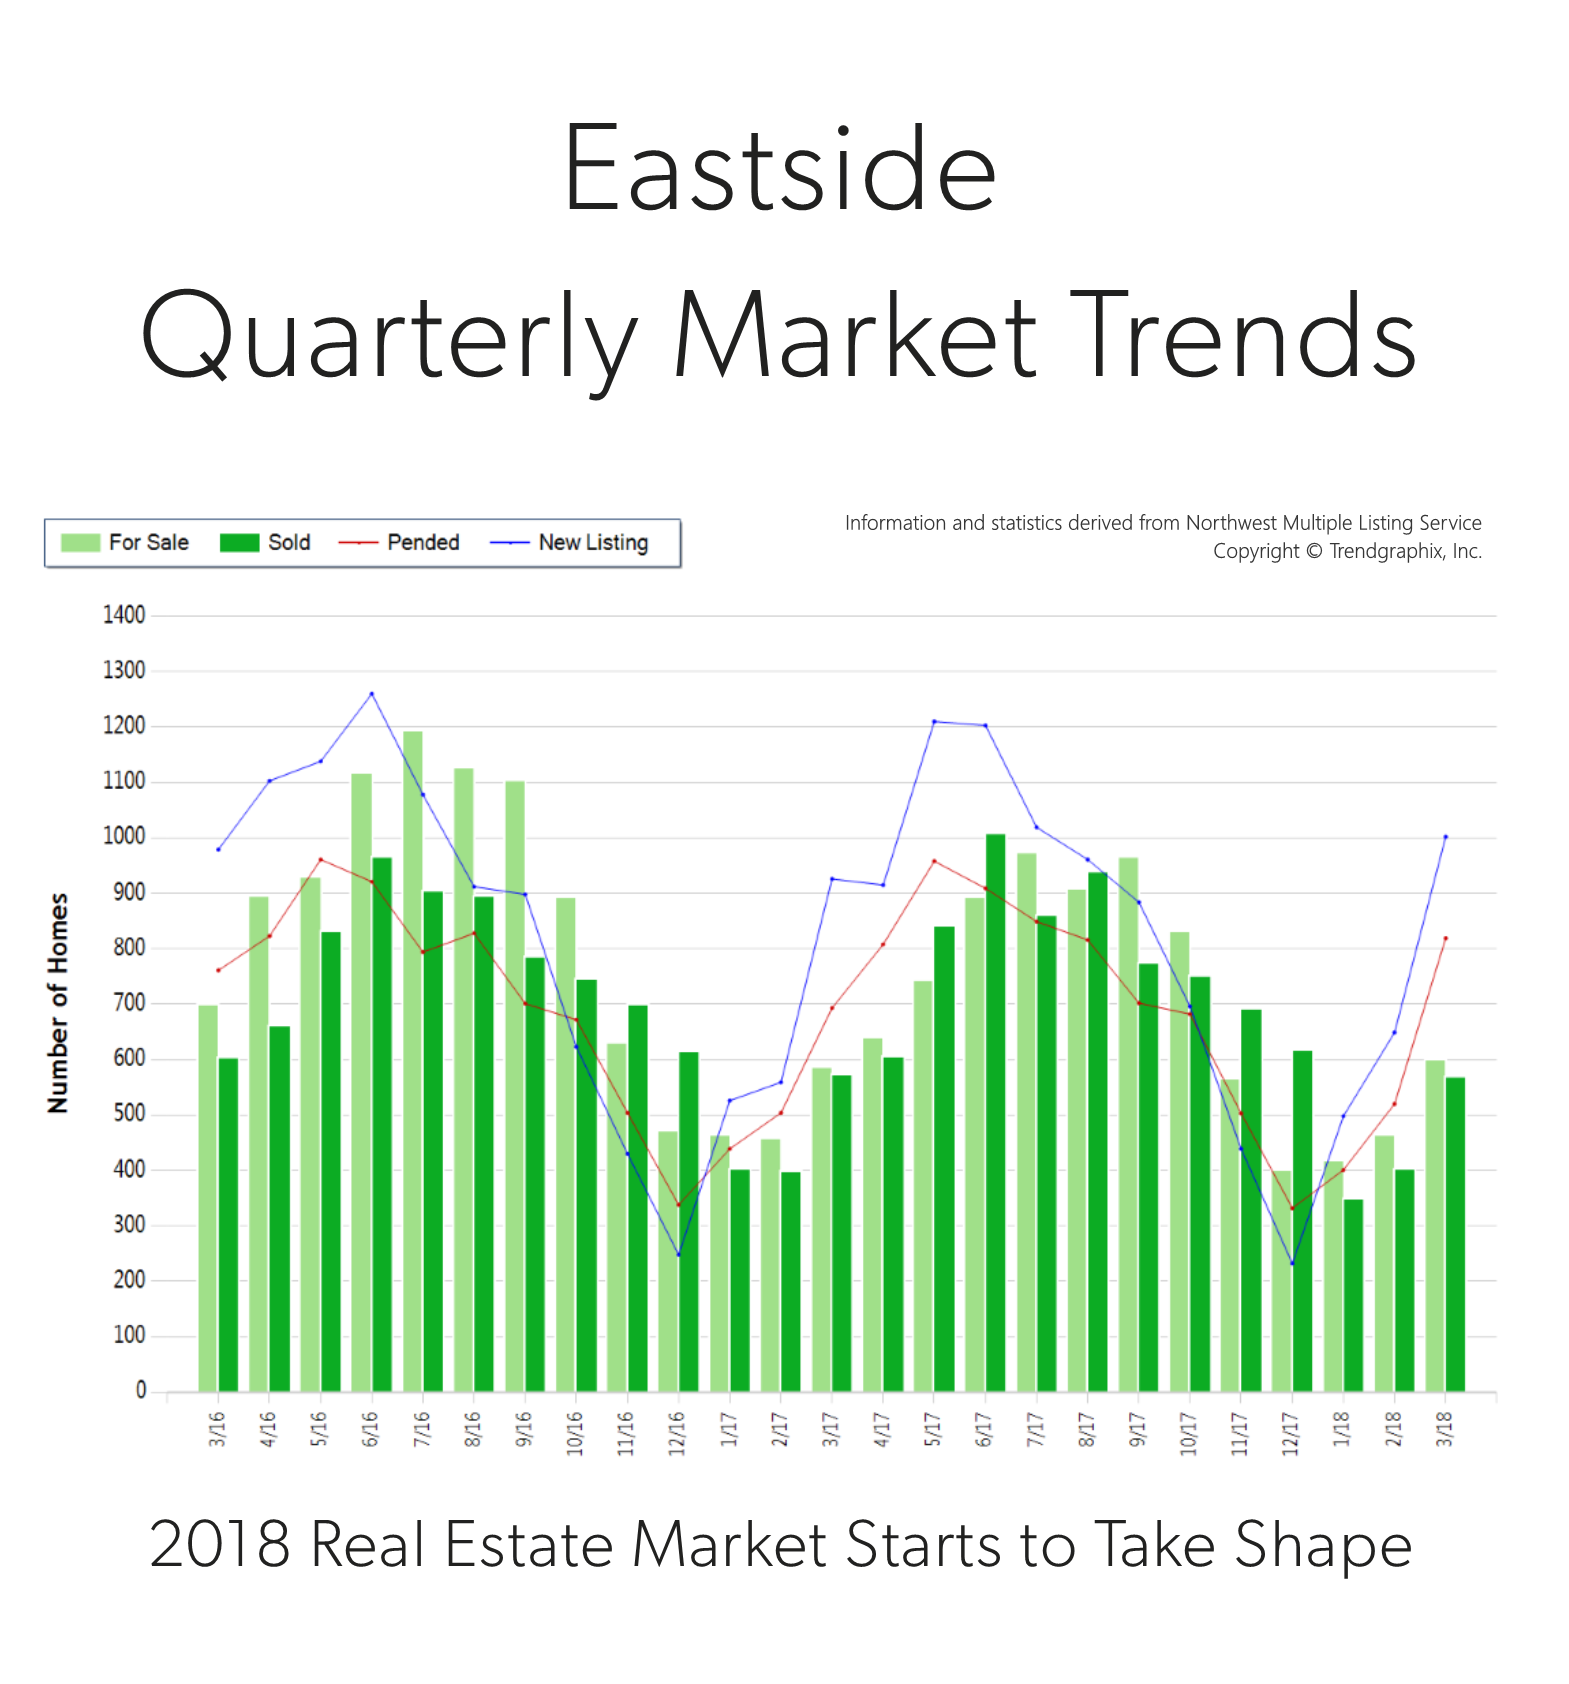
 It is the time of year when our market starts to take off. Spring is here and we are starting to see seasonal increases in inventory. In fact, there was a 54% increase in new listings in March compared to February. That increase was topped by a 58% rise in pending sales, illustrating very strong demand for housing in your area. Last month, the average list-to-sale price ratio (the amount the sale price topped the list price) was 103%, indicating that multiple offers were the norm. We ended the quarter with 0.7 months of inventory – the lowest level yet. More inventory would be absorbed by happy buyers looking for more selection and would help temper price growth, which is up 14% year-over-year.
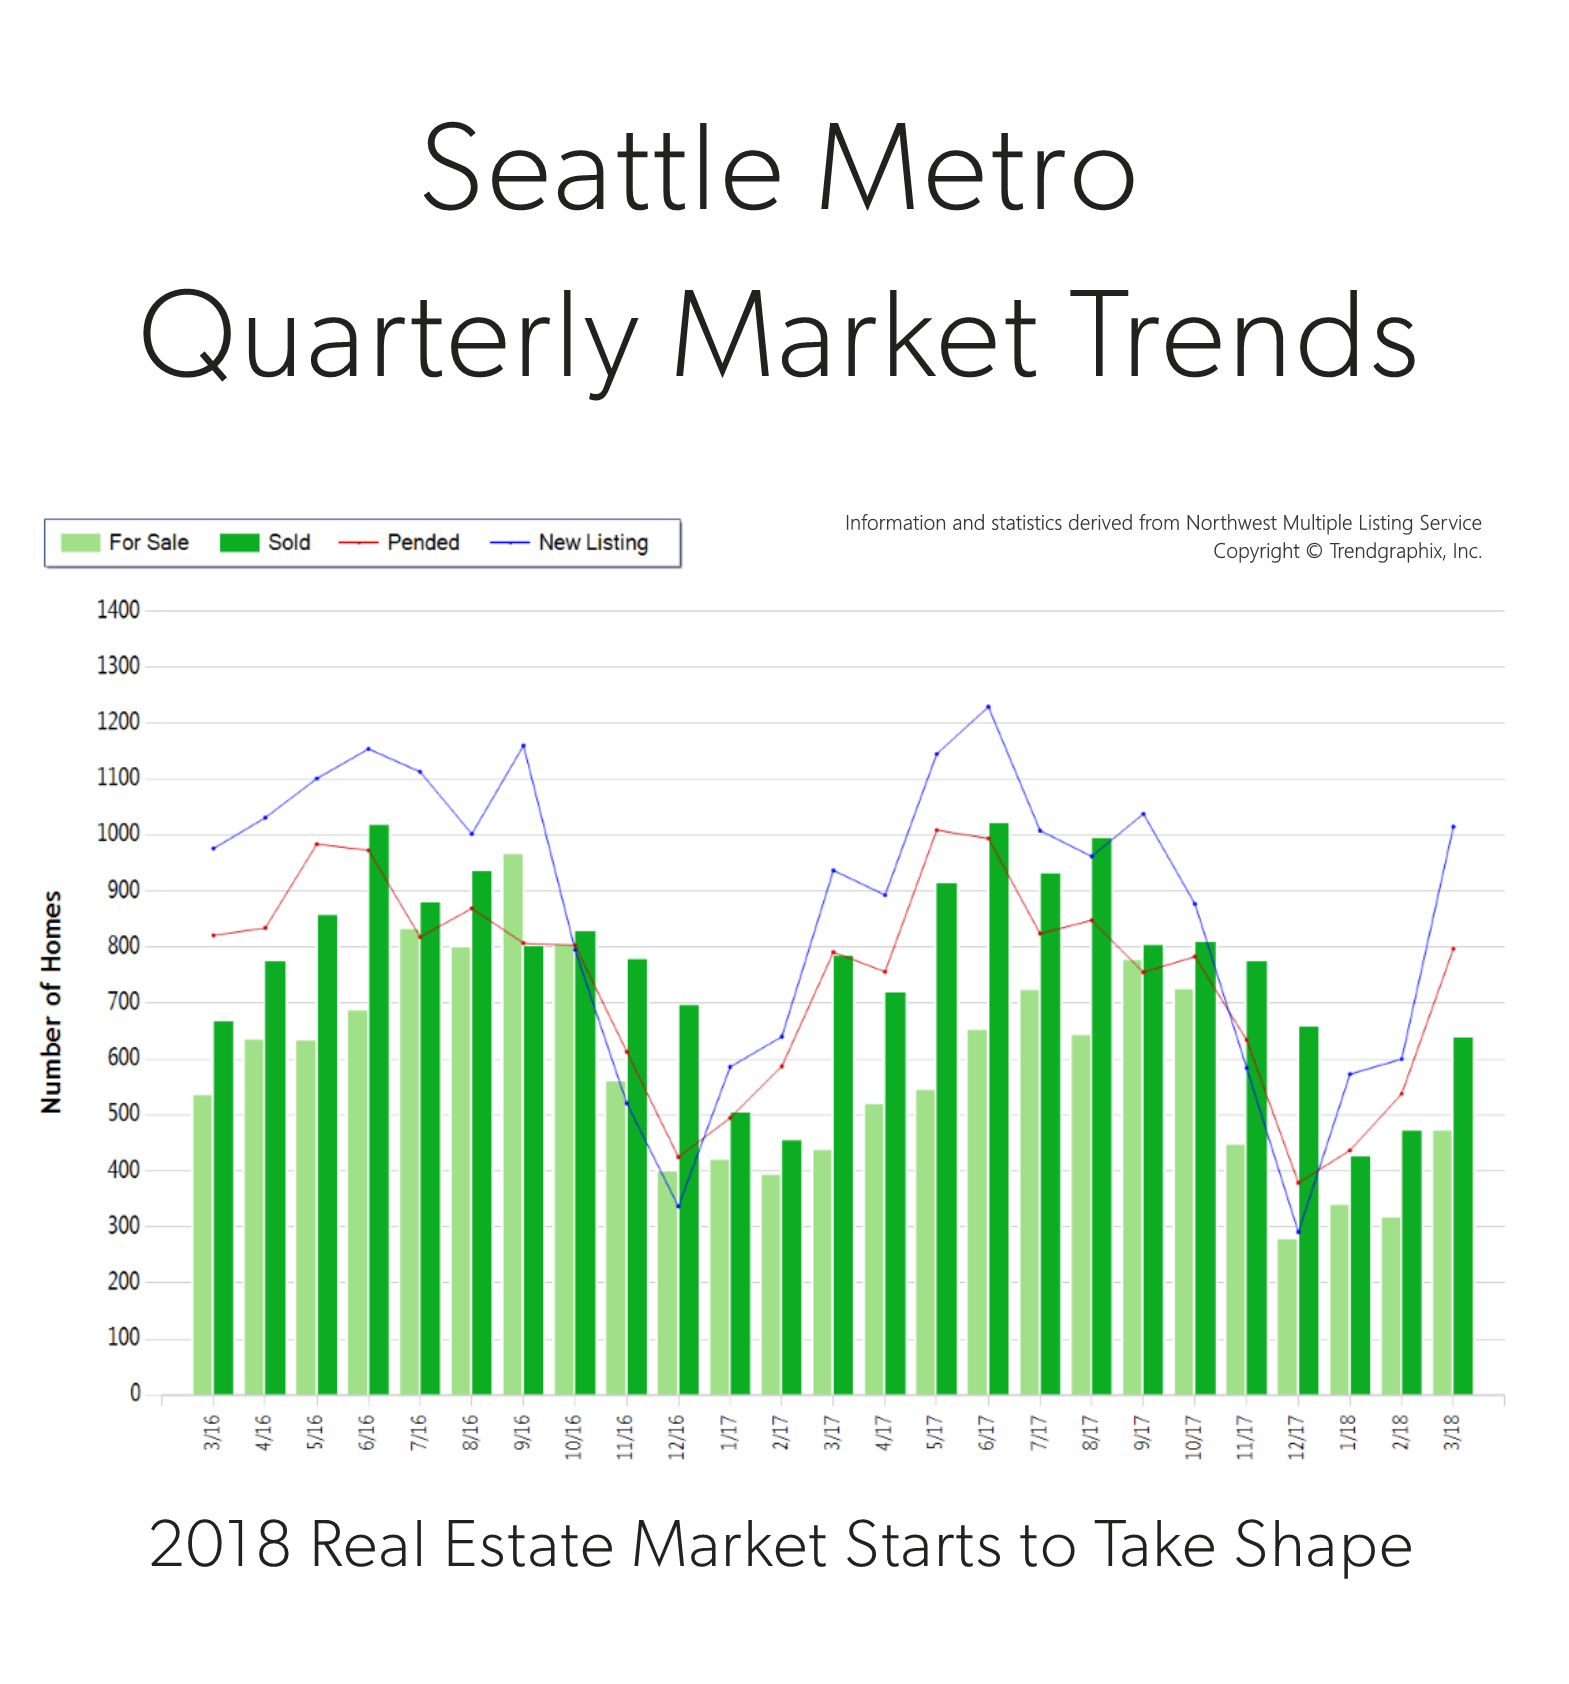
 It is the time of year when our market starts to take off. Spring is here and we are starting to see seasonal increases in inventory. In fact, there was a 69% increase in new listings in March compared to February. That increase was followed by a 48% rise in pending sales, illustrating very strong demand for housing in your area. Last month, the average list-to-sale price ratio (the amount the sale price topped the list price) was 105%, indicating that multiple offers were the norm. We ended the quarter with 0.6 months of inventory based on pending sales. More inventory would be absorbed by happy buyers looking for more selection and would help temper price growth, which is up 16% year-over-year.
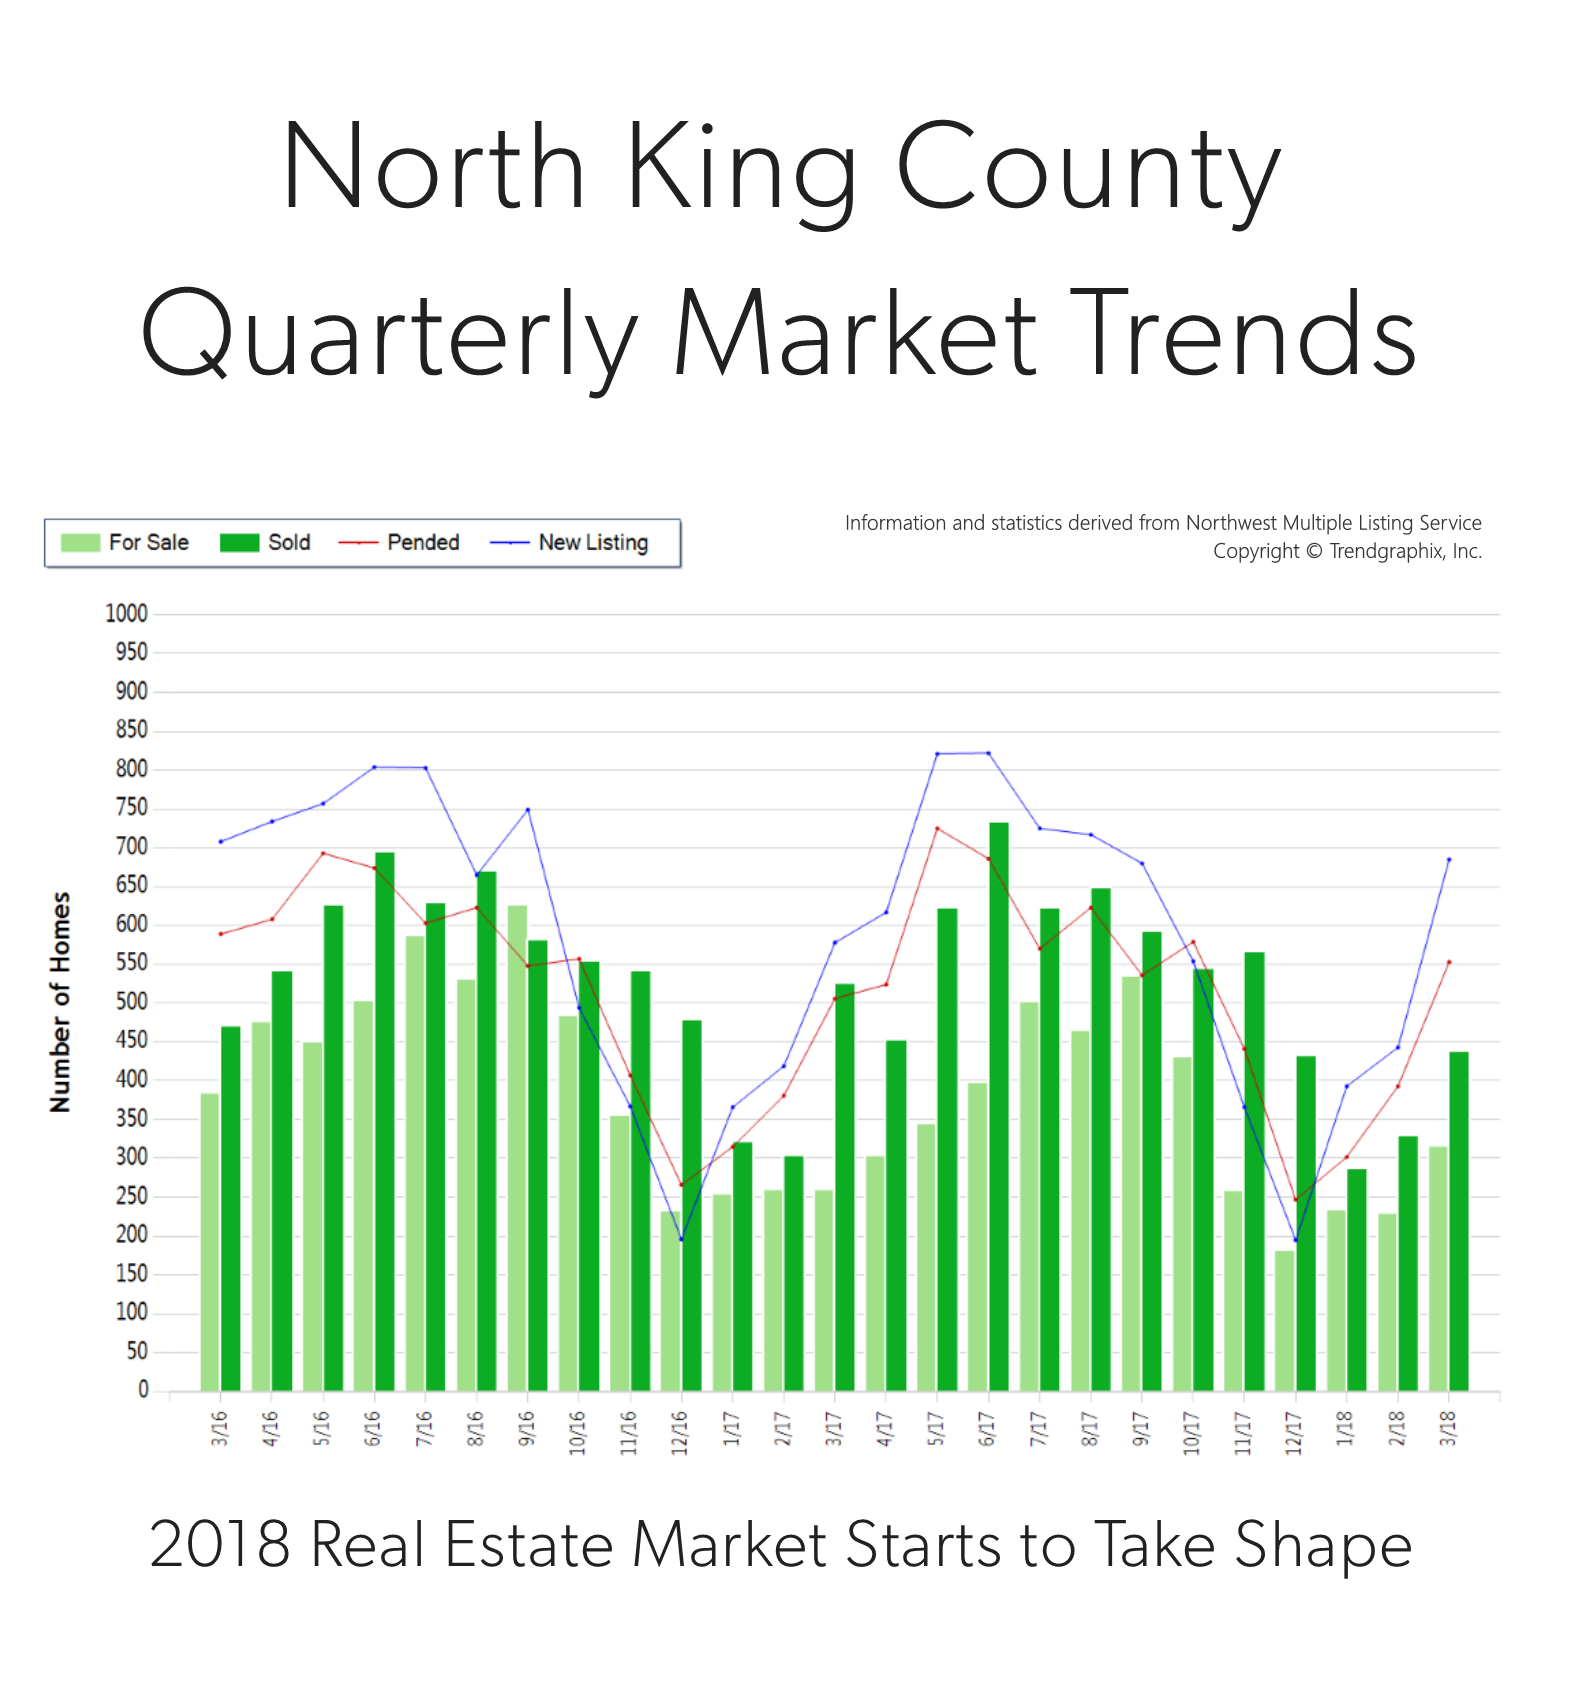
 It is the time of year when our market starts to take off. Spring is here and we are starting to see seasonal increases in inventory. In fact, there was a 55% increase in new listings in March compared to February. That increase was followed by a 41% rise in pending sales, illustrating very strong demand for housing in your area. Last month, the average list-to-sale price ratio (the amount the sale price topped the list price) was 106%, indicating that multiple offers were the norm. We ended the quarter with 0.6 months of inventory based on pending sales. More inventory would be absorbed by happy buyers looking for more selection and would help temper price growth, which is up 14% year-over-year.
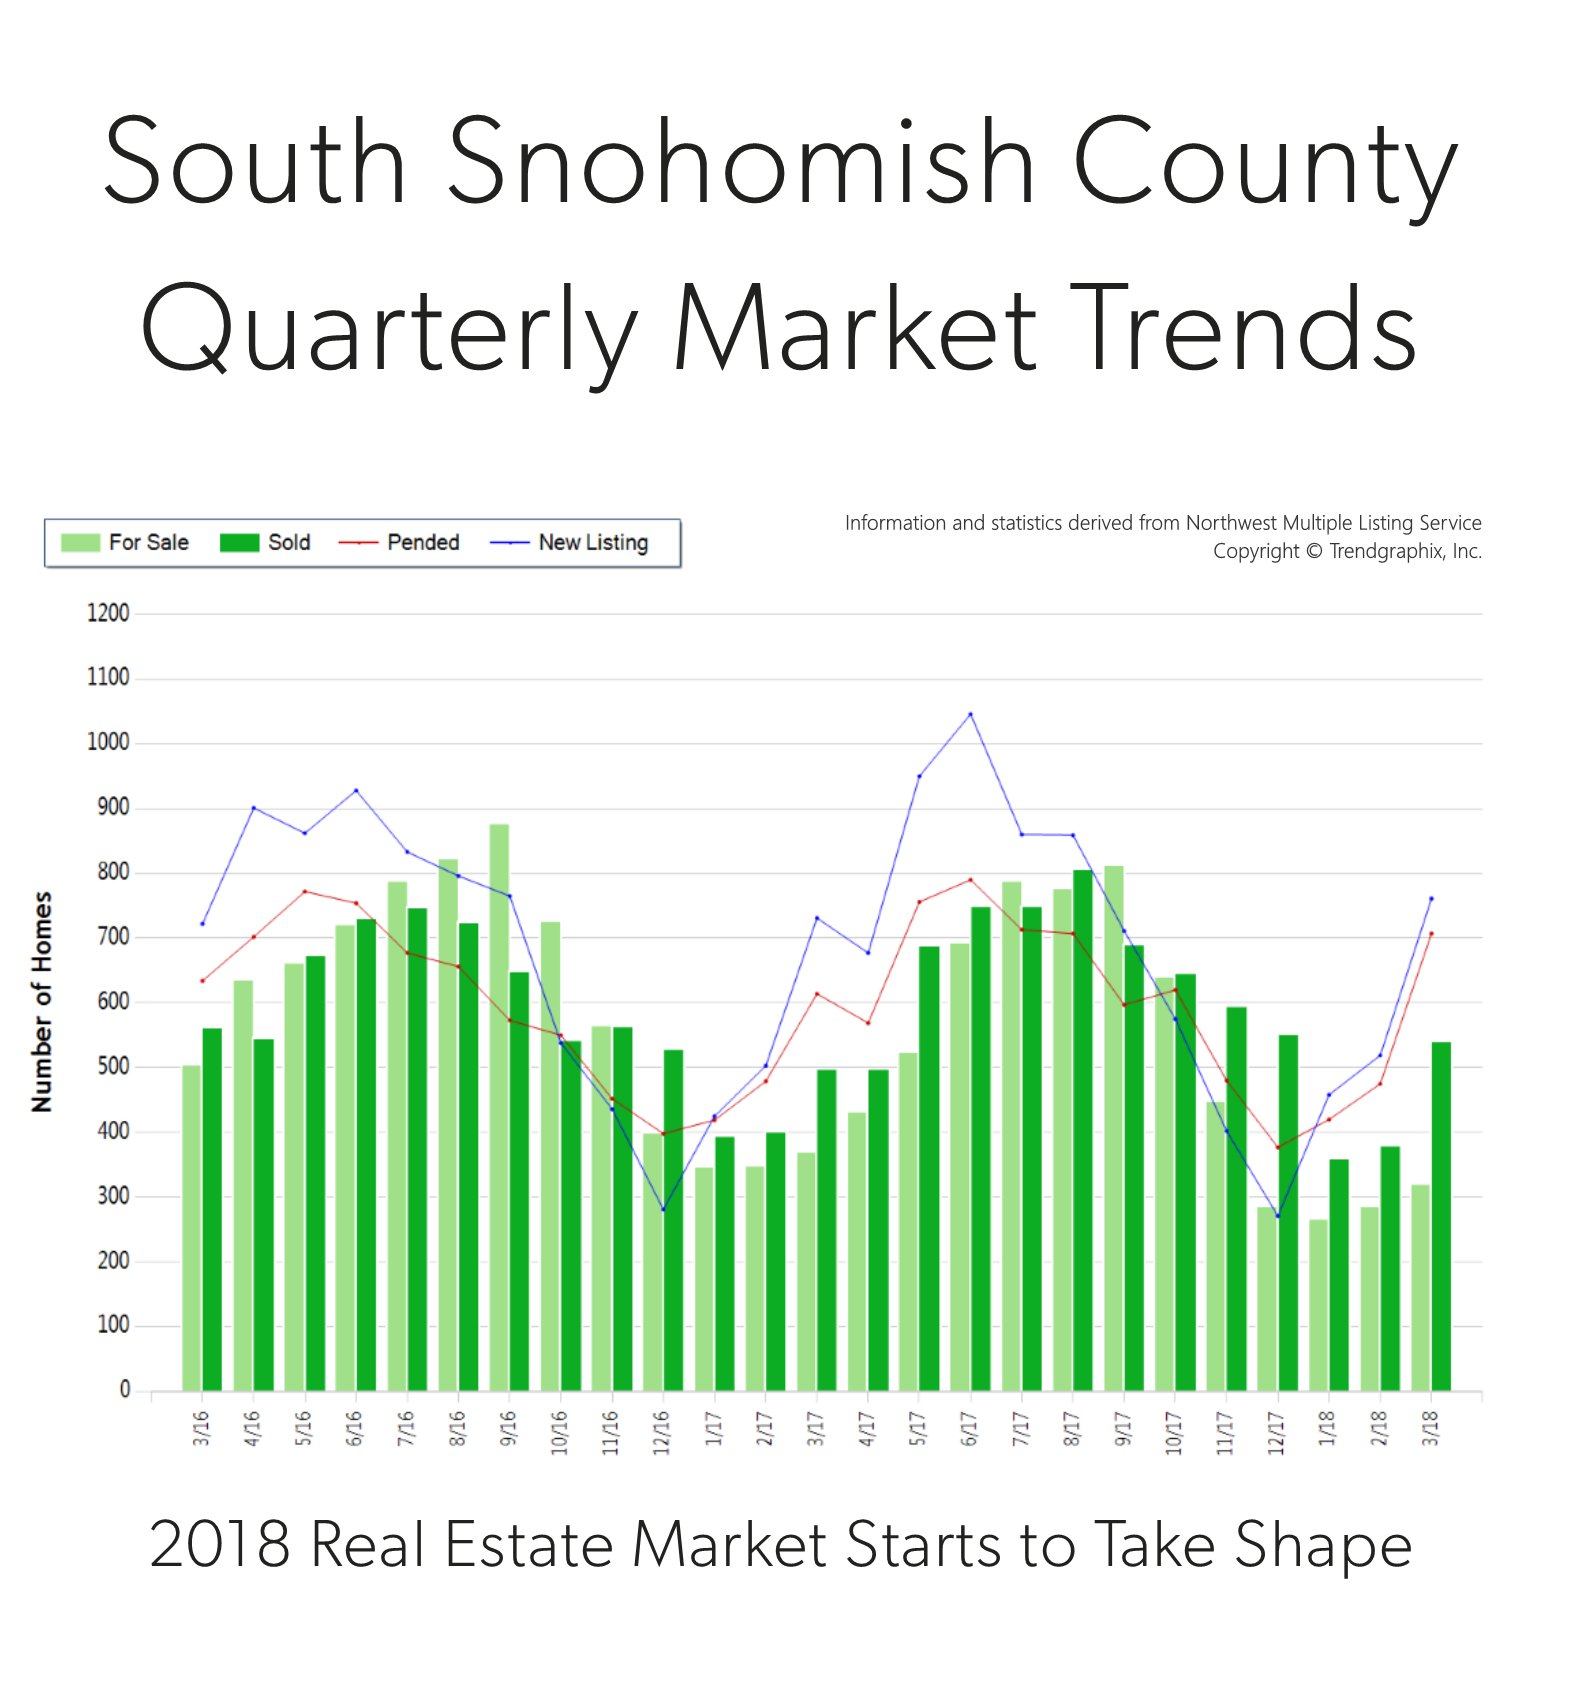
 It is the time of year when our market starts to take off. Spring is here and we are starting to see seasonal increases in inventory. In fact, there was a 47% increase in new listings in March compared to February. That increase was matched by a 48% rise in pending sales, illustrating very strong demand for housing in your area. Last month, the average list-to-sale price ratio (the amount the sale price topped the list price) was 103%, indicating that multiple offers were the norm. We ended the quarter with 0.5 months of inventory – the lowest level yet. More inventory would be absorbed by happy buyers looking for more selection and would help temper price growth, which is up 15% year-over-year.
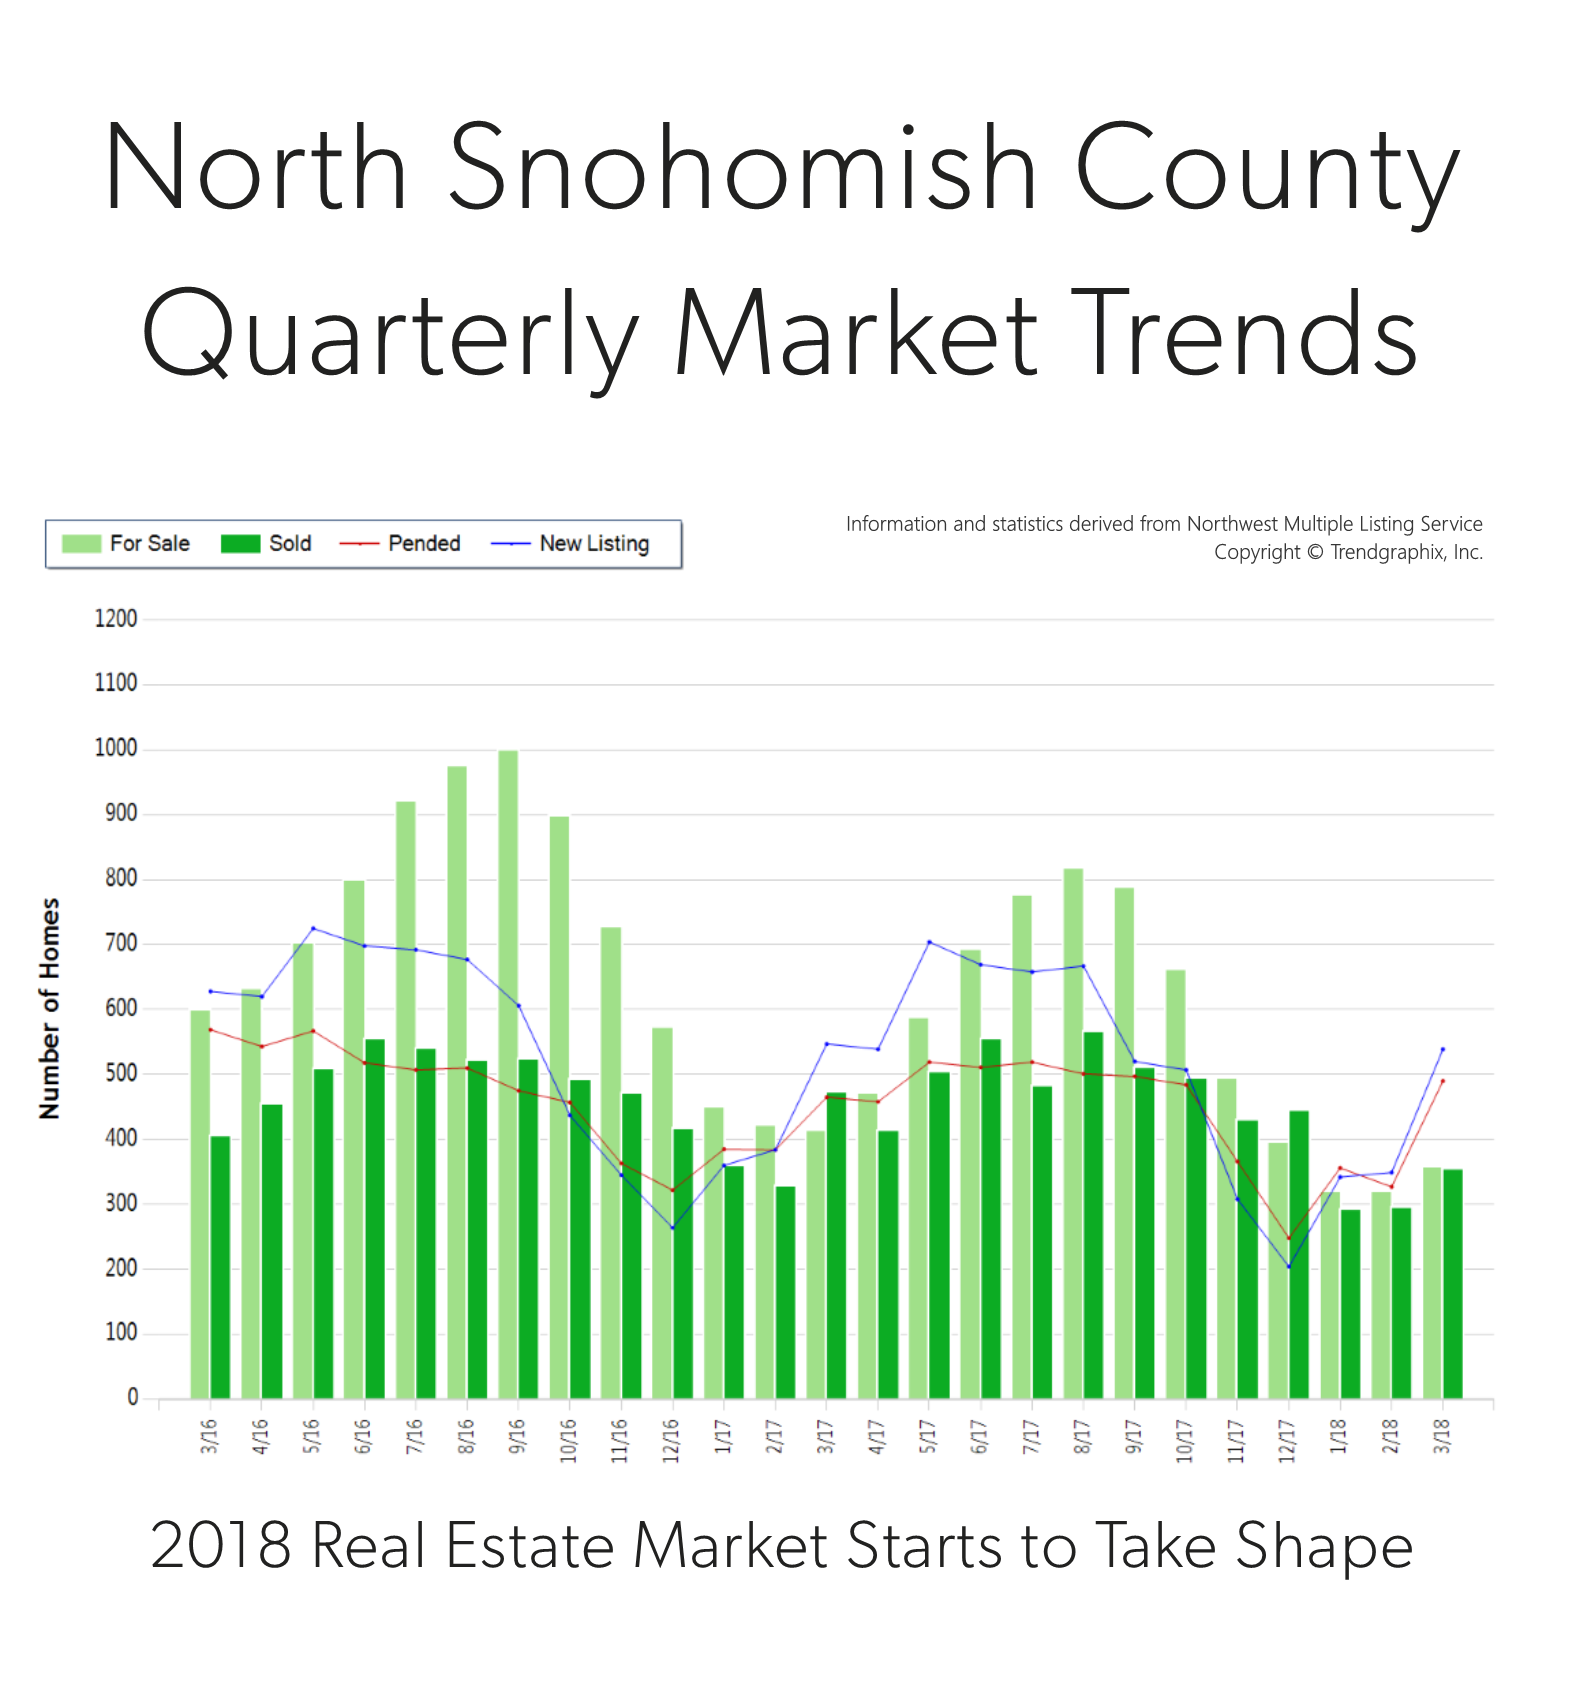
 It is the time of year when our market starts to take off. Spring is here and we are starting to see seasonal increases in inventory. In fact, there was a 54% increase in new listings in March compared to February. That increase was matched by a 50% rise in pending sales, illustrating very strong demand for housing in your area. Last month, the average list-to-sale price ratio was 100%, and average days on market was 35 days. We ended the quarter with 0.7 months of inventory – the lowest level yet. More inventory would be absorbed by happy buyers looking for more selection and would help temper price growth, which is up 12% year-over-year.
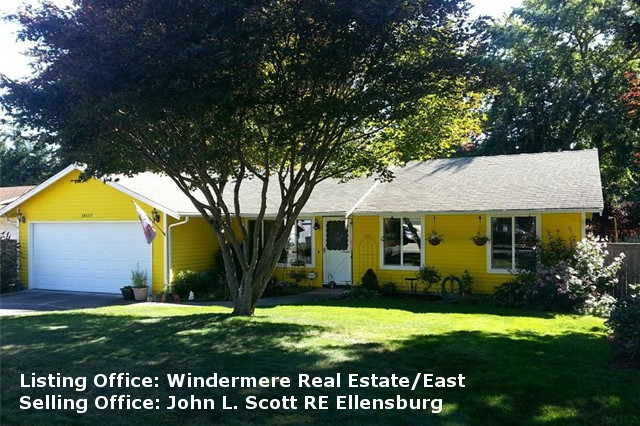


 I am commonly asked which improvements sellers should make to get the greatest return on their home sale. Every year The Remodeling 2018 Cost vs. Value Report (