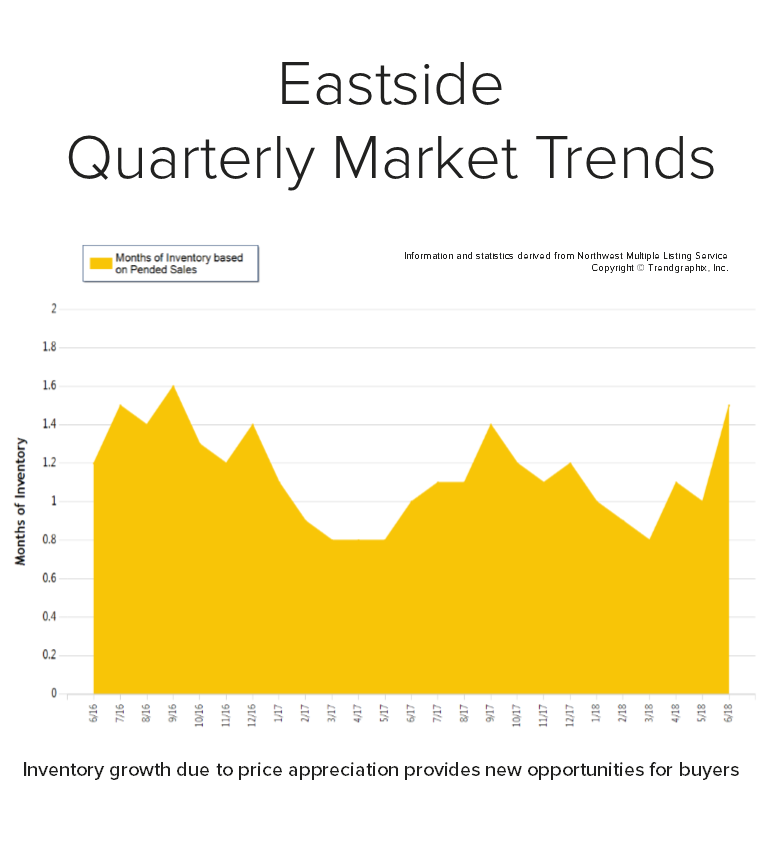
As we head into the summer months we are seeing a healthy jump in inventory in our area. In May, we saw the biggest jump in new listings in a decade! Price appreciation has created this phenomenon, motivating many people to make big moves with their equity. In fact, prices are up 11% year-over-year. We currently sit at 1.5 months of inventory based on pending sales. This more-equal balance of homes for sale compared to the first quarter has created great opportunities for buyers, finally! While it is still a seller’s market, it has eased up a bit. The average days on market in June was 19 days and the average list-to-sale price ratio was 101%.
Eastside real estate has a very high premium due to close-in commute times, great neighborhoods and strong school districts. In fact, the median price in June was $980,000. Sellers are enjoying great returns due to buyers choosing to lay down roots in our area, and buyers are securing mortgages with minor debt service due to low interest rates. The easing of inventory is a welcome change and is helping to temper price growth.
This is only a snapshot of the trends on the Eastside; please contact me if you would like further explanation of how the latest trends relate to you.
As we head into the summer months we are seeing a healthy jump in inventory in our area. In May, we saw the biggest jump in new listings in a decade! Price appreciation has created this phenomenon, motivating many people to make big moves with their equity. In fact, prices are up 13% year-over-year. We currently sit at 1.4 months of inventory based on pending sales. This more-equal balance of homes for sale compared to the first quarter has created great opportunities for buyers, finally! While it is still a seller’s market, it has eased up a bit. The average days on market in June was 15 days and the average list-to-sale price ratio was 101%.
South King County real estate has been an affordable option compared to “in-city” real estate. In fact, the median price in June was 75% higher in Seattle Metro. Sellers are enjoying great returns due to buyers choosing to lay down roots in our area, and buyers are securing mortgages with minor debt service due to low interest rates. The easing of inventory is a welcome change and is helping to temper price growth.
This is only a snapshot of the trends in south King County; please contact me if you would like further explanation of how the latest trends relate to you.
The late spring market brought about some welcomed change to our local real estate markets. In May, we experienced the largest increase in inventory in a decade! North King County and South Snohomish County are two examples of what is happening in all the markets across the Puget Sound as we head into the second half of 2018. Below is a breakdown of the current environment; further is an explanation of what it all means.
North King County (Ship Canal to Snohomish County Line):
38% increase in new listings from April to May 2018
16% more new listings in May 2018 vs. May 2017
Overall 5% more new listings over the last 12 months vs. the previous 12 months
Average list-to-sale price ratios reduce to 104% from 105% in May 2018
Median Price up 15% complete year over year, but down 1% vs. the previous month, landing at $815K.
South Snohomish County (Snohomish County Line to Everett):
27% increase in new listings from April to May 2018
10% more new listings in May 2018 vs. May 2017
Overall 2% more new listings over the last 12 months vs. the previous 12 months
Average list-to-sale price ratios reduce to 102% from 103% in May 2018
Median price up 12% complete year over year, but equal with the previous month, landing at $500K.
This increase in inventory is awesome! It is providing more selection for buyers and is helping temper price growth, which was increasing at an unsustainable level. It is still a Seller’s market by all means, which is defined by having three or less months of available inventory. Both market areas are still just under one month of inventory based on pending sales, but not as low as the two-week mark they were experiencing in March.
The increase in inventory is the result of pent up seller demand. From 1985-2008 the average amount of time a homeowner stayed in their home was 6 years. From 2008-2017 it grew to 9 years. With a resounding amount of equity under their belts, many homeowners are now deciding to make moves. Some are moving up to the next best thing and others are cashing out and leaving the area for a new beginning or retirement. This is providing buyers with the selection they have been waiting for after a very tenuous, inventory-starved start to 2018. The buyers that have stayed on the forefront of the market are now being rewarded with choices. These choices are best accompanied with keen discernment in order to craft the best negotiations – the broker they choose to align with is key.
The price analysis above indicates strong equity positions for sellers, but also a leveling off in price growth. Over the first quarter we saw prices increase month-over-month quite handily; now that more inventory is appearing and demand is being absorbed, price growth is not as extreme. This has highlighted the importance of having a strategic pricing and marketing plan for sellers wanting the highest price and shortest market time. The broker they choose to align with is key.
The importance of both buyers and sellers aligning with a knowledgeable, well-researched and responsive broker is paramount. One might think that it is “easy” to sell a house in this market, but the pricing research, home preparation, market exposure, varied marketing mediums, close management of all the communication, and how negotiations are handled can make or break a seller’s net return on the sale. With market times increasing, having a broker with a tight grasp on the changing environment will help create an efficient market time, resulting in the best price and terms for a successful closing. It is important that sellers do not overshoot this market, and it takes a broker with a keen gut sense rooted in in-depth research to help get them their desired results.
If you’re a buyer, it is overwhelmingly important that you are aligned with a broker that knows how to win in this market. The increase in selection has left some room for contemplation in some cases. Considering possible terms and price based on thorough market research as you head into negotiations are what set a highly capable selling broker apart and are required to prevail. With more selection coming to market, buyers have more to consider, and having a broker alongside them to help craft a strategy of negotiations will ensure they don’t overpay.
If you have any curiosities or questions regarding the value of your current home or purchase opportunities in today’s market, please contact me. It is my goal to help keep you informed and empower strong decisions.
Windermere Community Service Day 2018
On June 8th, my office spent our annual Community Service Day with the Snohomish Garden Club constructing trellises, weeding and staking beds and planting and labeling a half-acre of produce!
The Snohomish Garden Club will harvest this half-acre, which will yield close to 10,000 pounds of fresh produce to be donated to various food banks and senior centers in Snohomish County. The land for the garden is generously donated by the Bailey Family Farm.
Windermere’s Community Service Day was established in 1984 to offer agents and staff a chance to volunteer an entire workday to give back to the neighborhoods in which they live and work.
The Fourth of July is right around the corner. With it being on a Wednesday, keeping it local makes sense. Here is a list of local firework shows to help you celebrate the great U.S. of A!
It is that time of year when the sun comes out and the kids need to cool down and get their wiggles out outside. My blog has a list of local splash parks that are sure to beat the summer heat!
Don’t forget your blanket and the popcorn! It is the time of year when it’s nice enough to grab a movie outdoors – how fun! Here is a list of local outdoor movies planned for this summer.
Have you had dreams of owning a home or know someone that does? Jumping into the market as a first-time home buyer can be intimidating, especially within the wild ride of the Greater Seattle market; but there is hope! In an effort to illustrate the reality for first-time buyers in today’s market, my office got together and identified several sets of buyers who recently found success in today’s market and asked them to share their stories. We think this is timely because it is the time of year that we see a surge in inventory, which gives buyers more selection and opportunity. We have two stories to share below, but before we dive into those let’s defy some first-time home buyer myths.
First, many people think it is necessary to have a 20% down payment saved in order to make their first purchase. That is simply not true. While a 20% down payment can help make you more competitive and naturally lowers your monthly payment, it is not the only option. There are loan programs with down payments as low as 3%. Nationally, in March the average down payment for all loans was 10%. For first-timers it was 6% and repeat buyers it was 14%.
Second, expectations around credit scores can use some clarification as well. In March, the average credit score for all loans was 722. For Conventional loans it was 742 and for FHA it was 677. If your credit needs some work, contact me and I can put you in touch with one of my preferred lenders that can help with credit repair. There is hope, as these numbers are just the average. You’d be surprised that you don’t have to have perfect credit to get the process started.
Lastly, the cost to be a renter is high, and the return on your investment is nothing. Recently, Rent.com did a survey of landlords and 88% said they planned to raise their rents in the next 12 months. In the same survey, 53% said they’d rather place a new tenant with a higher rent versus renegotiate and renew with a current tenant. This sounds expensive and unstable. Owning leads to building wealth and putting down permanent roots.
Now that we’ve gained some clarity on what it takes to qualify in today’s market, let’s jump into these two honest, yet heartwarming local first-time home buyer stories.
Three Teenagers, One Bathroom, No More
This happy family of five just moved in to this house earlier this month. Two hard working parents, Brandy and Juan, with three teenagers were renting a 3-bedroom, 1-bath rambler in Edmonds and needed more space. It was time to make a move, and they had saved up a 3% down payment for a new home. Their budget was $400,000.
The first step in the home buying process was sitting down with their agent for the initial buyer consultation. This is where they discussed market conditions, desired features such as bedrooms, bathrooms and garage, and their budget. This lead them to explore which locations had the inventory that met their needs in order to stay within their budget. They had to marry these three key points – we like to call this the Triangle of Buyer Clarity. They then identified a few workable locations that had inventory which supported their desired features and their budget and went for it. This upfront research and partnership with their agent lead to Brandy and Juan finding success rather quickly, saving them money in an appreciating market, and a whole lot of strife.
They did this and ultimately bought a great house in Marysville which fit their budget, afforded them the features they desired, and still provided a manageable commute into Lynnwood. Their mortgage payment is higher than their rental rate, but relative to the size of their new home and their investment. Not to mention, they are now on the equity-building train and don’t have to worry about a landlord displacing them. Their monthly mortgage payment is fixed with an awesome low interest rate, and they are super happy to have more than one bathroom for their teenagers.
From North Seattle to West Seattle
First, how cool is this house? Super cool! That’s just how Paul and Ange feel about their newly purchased home in the Highland Park neighborhood of West Seattle. They just closed in early April and have already attended two neighborhood BBQ’s, received gifts from their new neighbors, discovered new parks and restaurants and, wait for it…shortened their commute.
Paul described his new neighborhood, Highland Park, as “magical.” Previously, Paul and Ange were renting in Wedgwood for six years and loved it there. So much that they could not imagine living anywhere else. When they started their home search in late 2017, they kept to strict search criteria of North Seattle because that is what they knew and it was comfortable. After making two offers and not prevailing because they were getting beat out on price, West Seattle was suggested to them as a more affordable option by their agent. The price corner of the Triangle of Buyer Clarity was making itself known as a challenge in North Seattle, so it was time to reconvene. They sat down with their agent and evaluated the market conditions in West Seattle compared to North Seattle and applied them to their feature list and budget, and voila: West Seattle was calling their names. You see, they wanted a more turn-key home, and the homes they were encountering in their price range in North Seattle needed a lot of work.
They went out on a limb and traveled over the bridge to start looking at homes. They quickly saw the difference – the homes they were interested in were not, as Paul said, “scary”! The anticipated repairs they would have to make to the homes they were able to afford in North Seattle were daunting and unexciting. They felt much more at ease with the features that the West Seattle homes provided within their price range. They just needed to get comfortable with the idea of moving to a different community.
When they found the house featured above, the leap of faith to West Seattle started to take shape. They prepped a strong offer, did their due diligence, and believe it or not, secured the home in a multiple offer situation at $805,000, which was not the highest price! They listened to their agent and wrote an offer with very strong terms as well as a very well-researched price. Their agent kept in close contact with the listing agent and the Sellers chose their offer due to all of these factors.
Since moving in almost two months ago, they find themselves in a state of excitement and discovery every day. The community has been welcoming and conversations with neighbors and the random stranger at the grocery store come easily. Paul has observed a strong sense of curiosity within his new community as people are new to the area and are encouraged to build relationships and make discoveries.
In the end, Paul and Ange remained within their price range, bought a home with all the features they wanted, but made what seemed to be at the time, a compromise on location. That compromise ended up being, as they put it, magical! They have never looked back to Wegdwood with regret, only excitement over what their new neighborhood might bring.
The point of these two stories is to debunk the sentiment we hear from time to time, that first-time home buyers cannot find success in our market. With a well-laid-out plan strategically constructed by the agent and client, we are seeing many happy stories for first-timers. The end result is putting these new homeowners on the path to building wealth, growing thriving communities, and making their house their home.
If you or someone you know has dreamed about buying their first home, please reach out. It is my goal to help identify the opportunities that are available, the strategies that find success, and to educate along the way.
We are so fortunate here at Windermere to have Matthew Gardner help keep us informed on our economy and the real estate market. Each quarter Matthew compiles in-depth research on counties from across Western Washington. Click here to download Matthew’s full Q1 report.
When you shop at a local Farmers Market, you’re buying outstanding freshness, quality and flavor. Knowing exactly where your food comes from and how it was grown provides peace of mind for your family. Plus, you’re supporting a sustainable regional food system that helps small family farms stay in business; protects land from development, and provides the community with fresh, healthy food. Find one near you!
Double-digit price appreciation has taken place for over 3 years now, so prices are up. Way up. In fact, in just the last year we have seen prices rise 14% year-over-year. When talking with people about our real estate market, the conversation often involves the question, “are we headed toward a bubble?” I get asked this question often, and I can understand why. With the Great Recession not too far back in our rear-view mirror, the fear that surrounds the bottom dropping out in our home values is real. The large price gains might seem familiar to the gains of the previous up market of 2004-2007, but the environment is much different, and that is why we are not headed toward a housing collapse.
Lending Requirements & Down Payments
Previous lending practices allowed people to get into homes with high debt-to-income ratios, low credit scores, risky loan programs, and undocumented incomes. They called this sub-prime lending. This led to the housing bubble bursting 10 years ago – because people received mortgages they were not equipped to handle. Borrowers were not properly qualified for their monthly payments, and with minimal down payments they had no skin in the game. There were also a ton of adjustable rate mortgages and interest-only loans, which created negative equity positions. In July 2007, the sub-prime loan products disappeared and literally became history overnight. This eliminated a large part of the buyer pool creating over supply, not to mention the foreclosures that followed due to these ill-equipped homeowners walking away. The combination of these two factors caused prices to plummet.
Conversely, in March of this year, the average credit score for an approved conventional loan according to Ellie Mae was 752. Banks are scrutinizing their borrowers much more thoroughly than in the past. Credit scores are only the start; solid documentation of employment, assets, and debt are all passed through strict underwriting standards before closing. During the days of sub-prime lending, banks were funding loans with scores as low as 560! This, coupled with many zero-down loan programs and the risky terms mentioned above, left many new homeowners with little to no equity. When you have little or no equity it is very easy to bail.
In addition to heartier credit scores, down payments have increased significantly. According to Attom Data Solutions the average down payment is 18%. To put this in perspective, the median price in Seattle Metro in the first quarter of 2018 was $775,000. 18% of that is $139,500! There is a marked difference in the connection to one’s investment with such a large amount on the line versus the common 0% down loans of the sub-prime era. When people have high equity levels they are not likely to abandon their home or miss payments.
Our Thriving Local Economy, Job Creation & Californians
According to Matthew Gardner, Windermere’s Chief Economist, it is forecasted that there will be 46,000 more jobs in the Seattle Metro area in 2018. This has created high numbers of residual migration into our area from other states. In 2016 there were 50,000 people that moved here, and 47,000 in 2017. Many of these new Washingtonians are former Californians, specifically from the Bay Area. Unbelievably, our prices are attractive to this group, as they can take a similar tech job here and make the same income with a lower cost of living. If untethered and up for a move, it’s a no-brainer.
The most influential factor that has led the run on prices has been low inventory levels coupled with high housing demand. It’s simply the concept of supply and demand. The growth of companies like Amazon, Google, and Facebook in our area has created increased demand, especially for homes closer to job centers resulting in shorter commutes. When you have increased demand and not enough homes to absorb the buyers, prices go up. Over the last three years we have easily seen a 10%+ increase in prices year-over-year. That is above the norm, and will slow down once inventory increases. That slowdown will be welcomed and it will not be a collapse in values or a bubble bursting.
Interest Rates
Interest rates are increasing, and it is predicted they will reach close to 4.95% by the end of the year. This will naturally curtail price growth because it will not be as cheap to borrow money, which will cause buyers to temper their pricing ceilings. Bear in mind, that an interest rate of 4.95% is still historically low, we’ve just been incredibly fortunate to be able to secure long term loans with minimal debt service. The average interest rate over the last 30 years is 7%.
I understand that the recent increase in home prices has been big and that it might remind you of the previous up market before the crash. I hope that digging into the topics above has shed some light on how it is different. I always welcome the opportunity to have a conversation about these hot topics and discern how they relate to you. As always, it is my goal to help keep my clients informed and empower strong decisions. Please let me know if I can answer any questions or help you or anyone you know with their real estate needs.
Tax Reform
Now that the 2017 tax deadline has come and gone it is time to think about how the new tax reform of 2018 might affect you next year. A few notable items are the limited mortgage interest rate deduction capped at $750,000, limited property tax deduction capped at $10,000 and moving expenses can only be written off by members of the armed services. Read the full article here and take notes, so you are prepared for next year’s tax season.
Windermere Foundation
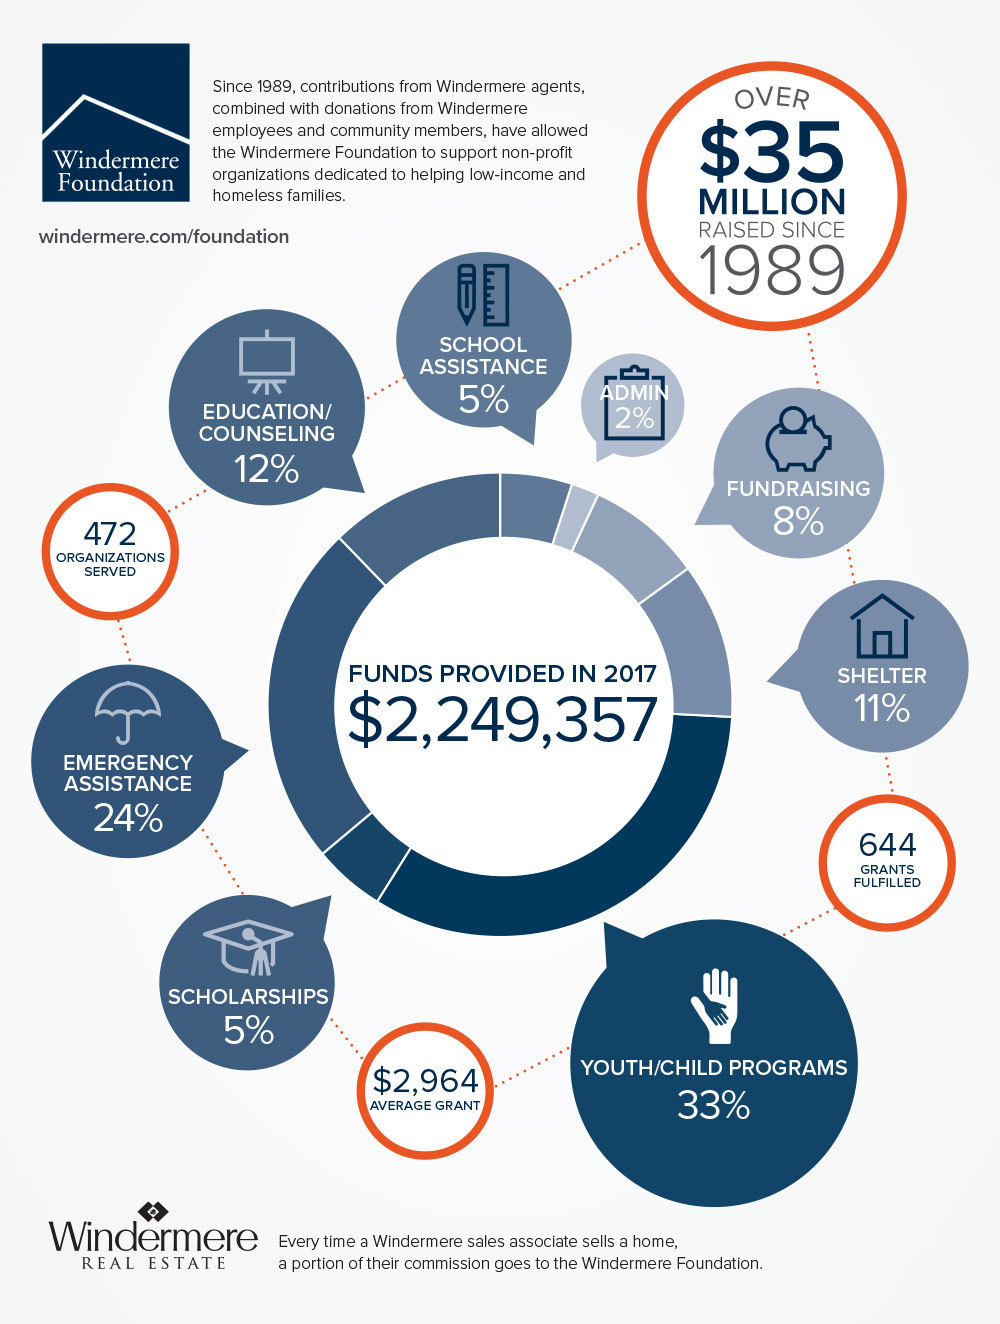
Thanks to your continued support, the Windermere Foundation collected over $330,000 in donations in the first quarter of 2018. Fifty-eight percent of the donations came from individual contributions and fundraisers, while 42 percent came from donations through Windermere agent sales transactions. This brings our grand total to $35,869,961 raised since 1989. We are very close to reaching the $36-million mark! These funds go towards supporting low-income and homeless families right here in our local community.
Thanks again for all you do to support the Windermere Foundation. Together, we are able to make a difference for those in need in our local communities.
The current break-even horizon* in the Seattle metro area is 1.6 years!
*The amount of time you need to own your home in order for owning to be a superior financial decision.
With rising rental rates, historically low interest rates, and home prices on the rise, the advantage of buying vs. renting is becoming clearer each month.
In fact, Seattle has seen some of the sharpest rent hikes in the country over the last year! Snohomish County has seen a huge increase in apartment growth and rising rental rates as well. There are several factors to consider that will lead you to make the best decision for your lifestyle and your financial bottom line. Zillow Research has determined the break-even point for renting vs. buying in our metro area. In other words, the amount of time you need to own your home in order for owning to be a superior financial decision. Currently in Seattle the break-even point is 1.6 years – that is quick! What is so great about every month that ticks away thereafter is that your nest egg is building in value.
I am happy to help you or someone you know assess your options; please contact me anytime.
These assumptions are based on a home buyer purchasing a home with a 30-year, fixed-rate mortgage and a 20 percent down payment; and a renter earning five percent annually on investments in the stock market.

 Facebook
 X
X
 Pinterest
 Copy Link
 As we head into the summer months we are seeing a healthy jump in inventory in our area. In May, we saw the biggest jump in new listings in a decade! Price appreciation has created this phenomenon, motivating many people to make big moves with their equity. In fact, prices are up 11% year-over-year. We currently sit at 1.5 months of inventory based on pending sales. This more-equal balance of homes for sale compared to the first quarter has created great opportunities for buyers, finally! While it is still a seller’s market, it has eased up a bit. The average days on market in June was 19 days and the average list-to-sale price ratio was 101%.
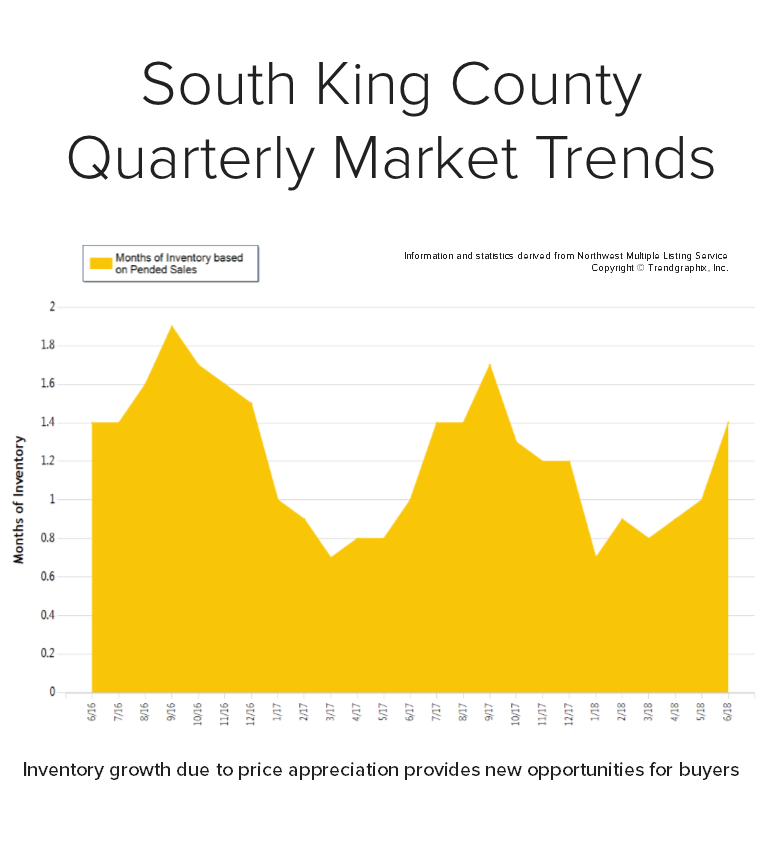
 As we head into the summer months we are seeing a healthy jump in inventory in our area. In May, we saw the biggest jump in new listings in a decade! Price appreciation has created this phenomenon, motivating many people to make big moves with their equity. In fact, prices are up 13% year-over-year. We currently sit at 1.4 months of inventory based on pending sales. This more-equal balance of homes for sale compared to the first quarter has created great opportunities for buyers, finally! While it is still a seller’s market, it has eased up a bit. The average days on market in June was 15 days and the average list-to-sale price ratio was 101%.
 The late spring market brought about some welcomed change to our local real estate markets. In May, we experienced the largest increase in inventory in a decade! North King County and South Snohomish County are two examples of what is happening in all the markets across the Puget Sound as we head into the second half of 2018. Below is a breakdown of the current environment; further is an explanation of what it all means.
 The Fourth of July is right around the corner. With it being on a Wednesday, keeping it local makes sense. Here is a list of local firework shows to help you celebrate the great U.S. of A!
 It is that time of year when the sun comes out and the kids need to cool down and get their wiggles out outside. My blog has a list of local splash parks that are sure to beat the summer heat!
 Don’t forget your blanket and the popcorn! It is the time of year when it’s nice enough to grab a movie outdoors – how fun! Here is a list of local outdoor movies planned for this summer.
 Have you had dreams of owning a home or know someone that does? Jumping into the market as a first-time home buyer can be intimidating, especially within the wild ride of the Greater Seattle market; but there is hope! In an effort to illustrate the reality for first-time buyers in today’s market, my office got together and identified several sets of buyers who recently found success in today’s market and asked them to share their stories. We think this is timely because it is the time of year that we see a surge in inventory, which gives buyers more selection and opportunity. We have two stories to share below, but before we dive into those let’s defy some first-time home buyer myths.


 The current break-even horizon* in the Seattle metro area is 1.6 years!