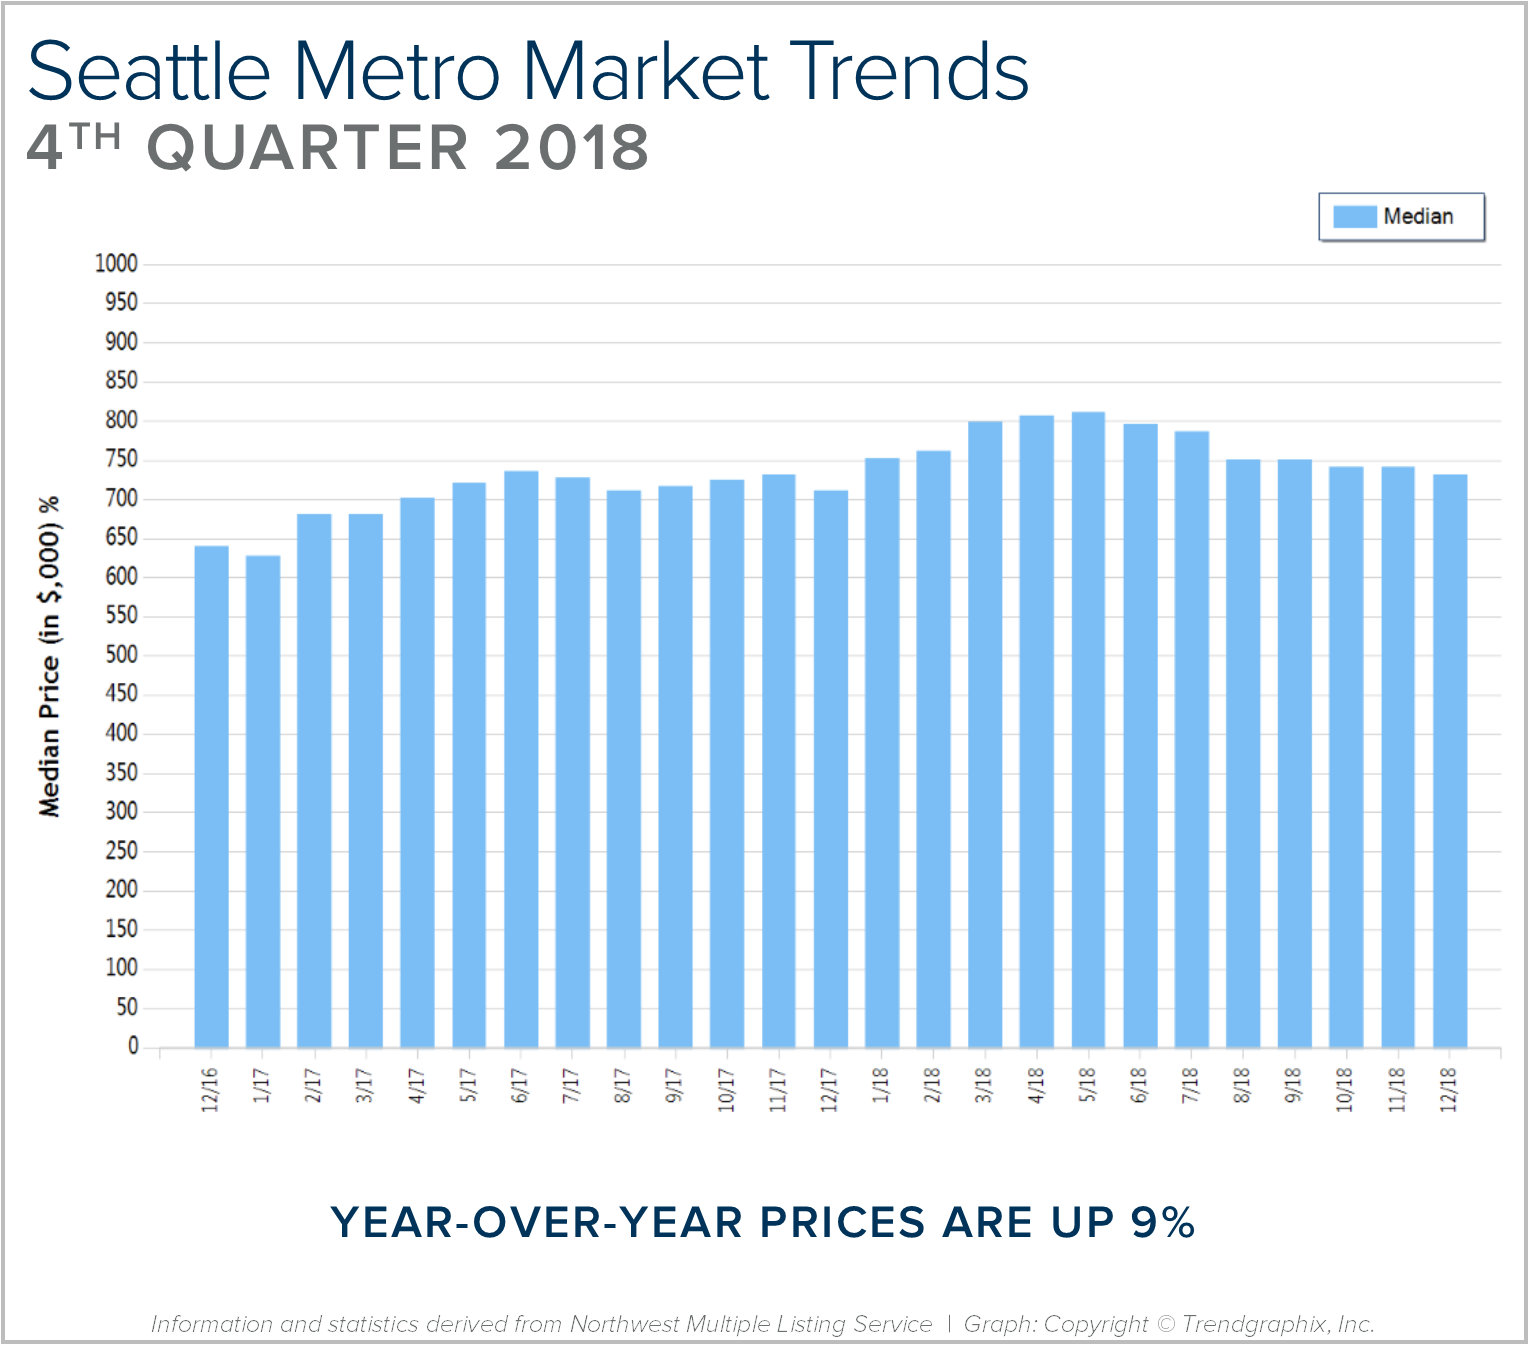
2018 was a year of change and growth. The market shifted from an extreme seller’s market, but still had strong gains. Year-over-year, median price is up 9% and since 2012 has increased 93%! Over the last 19 years, the average year-over-year price increase has been 6%. This puts into perspective the growth we have experienced, resulting in well-established equity levels. In 2018, inventory averaged 1.5 months, double that of 2017. This caused the month-over-month price gains to slow, and we experienced a price correction over the second half of the year. We expect to see more average levels of price appreciation in 2019 as the market continues to balance out.
After six years of expansion resulting in an extreme seller’s market, in 2018 we encountered a market shift in the late spring. Inventory increased, interest rates took a jump, and demand took a step back to re-evaluate the new playing field. This resulted in a tempering of month-over-month price appreciation, and has established some long-awaited balance. This balance has brought opportunities for both buyers and sellers. Buyers have more selection and are negotiating terms like inspection items and concessions. Sellers are sitting on 6+ years of equity growth, and are now able to sell their home and make a move without fearing where they will land next. Interest rates are still well below the 30-year average, currently hovering just under 5%. We are seeing demand start to re-engage now that the new normal has settled in.
This is only a snapshot of the trends the Seattle Metro area; please contact me if you would like further explanation of how the latest trends relate to you.
2018 was a year of change and growth. The market shifted from an extreme seller’s market, but still had strong gains. Year-over-year, median price is up 9% and since 2012 has increased 92%! Over the last 19 years, the average year-over-year price increase has been 6%. This puts into perspective the growth we have experienced, resulting in well-established equity levels. In 2018, inventory averaged 1.5 months, double that of 2017. This caused the month-over-month price gains to slow, and we experienced a price correction over the second half of the year. We expect to see more average levels of price appreciation in 2019 as the market continues to balance out.
After six years of expansion resulting in an extreme seller’s market, in 2018 we encountered a market shift in the late spring. Inventory increased, interest rates took a jump, and demand took a step back to re-evaluate the new playing field. This resulted in a tempering of month-over-month price appreciation, and has established some long-awaited balance. This balance has brought opportunities for both buyers and sellers. Buyers have more selection and are negotiating terms like inspection items and concessions. Sellers are sitting on 6+ years of equity growth, and are now able to sell their home and make a move without fearing where they will land next. Interest rates are still well below the 30-year average, currently hovering just under 5%. We are seeing demand start to re-engage now that the new normal has settled in.
This is only a snapshot of the trends in north King County; please contact me if you would like further explanation of how the latest trends relate to you.
2018 was a year of change and growth. The market shifted from an extreme seller’s market, but still had strong gains. Year-over-year, median price is up 9% and since 2012 has increased 88%! Over the last 19 years, the average year-over-year price increase has been 6%. This puts into perspective the growth we have experienced, resulting in well-established equity levels. In 2018, inventory averaged 1.6 months, higher than 2017. This caused the month-over-month price gains to slow, and we experienced a price correction over the second half of the year. We expect to see more average levels of price appreciation in 2019 as the market continues to balance out.
After six years of expansion resulting in an extreme seller’s market, in 2018 we encountered a market shift in the late spring. Inventory increased, interest rates took a jump, and demand took a step back to re-evaluate the new playing field. This resulted in a tempering of month-over-month price appreciation, and has established some long-awaited balance. This balance has brought opportunities for both buyers and sellers. Buyers have more selection and are negotiating terms like inspection items and concessions. Sellers are sitting on 6+ years of equity growth, and are now able to sell their home and make a move without fearing where they will land next. Interest rates are still well below the 30-year average, currently hovering just under 5%. We are seeing demand start to re-engage now that the new normal has settled in.
This is only a snapshot of the trends in north Snohomish County; please contact me if you would like further explanation of how the latest trends relate to you.
2018 was a year of change and growth. The market shifted from an extreme seller’s market, but still had strong gains. Year-over-year, median price is up 9% and since 2012 has increased 85%! Over the last 19 years, the average year-over-year price increase has been 6%. This puts into perspective the growth we have experienced, resulting in well-established equity levels. In 2018, inventory averaged 1.5 months, double that of 2017. This caused the month-over-month price gains to slow, and we experienced a price correction over the second half of the year. We expect to see more average levels of price appreciation in 2019 as the market continues to balance out.
After six years of expansion resulting in an extreme seller’s market, in 2018 we encountered a market shift in the late spring. Inventory increased, interest rates took a jump, and demand took a step back to re-evaluate the new playing field. This resulted in a tempering of month-over-month price appreciation, and has established some long-awaited balance. This balance has brought opportunities for both buyers and sellers. Buyers have more selection and are negotiating terms like inspection items and concessions. Sellers are sitting on 6+ years of equity growth, and are now able to sell their home and make a move without fearing where they will land next. Interest rates are still well below the 30-year average, currently hovering just under 5%. We are seeing demand start to re-engage now that the new normal has settled in.
This is only a snapshot of the trends in south Snohomish County; please contact me if you would like further explanation of how the latest trends relate to you.
2018 was a year of growth and change. The dynamic greater Seattle area and hottest real estate market in the country started to head toward some balance. After six years of expansion resulting in an extreme seller’s market, we encountered a market shift in the late spring. Where it is tricky, is the media paints a somewhat scary picture, cherry picking month-over-month statistics instead of looking at the entire year in review. I thought I’d take the opportunity to recap what led to this shift and where we might be headed.
In May, we saw a 40% increase in homes for sale. For so many years, the lack of inventory was the central theme of the market, with inventory levels as low as a two-week supply in the first quarter of 2018. These constricted inventory levels led to huge price escalations from buyers competing in multiple offers. It was not uncommon to have 10 buyers fighting over one house, resulting in a sale price 20% over the list price. That type of price growth is unreasonable and the result of the extreme market conditions. In May, that changed as many sellers started to come to market. Suddenly, buyers had more choices and multiple offers started to wane. This phenomenon led to a decrease in month-over-month price appreciation.
It just so happened that the increase in inventory was accompanied by two other influential factors. We had an increase in interest rate, and the now-repealed “Seattle Head Tax” was passed on May 14th, 2018 by the Seattle City Council.
Interest rates had been hovering in the low 4%s during all of 2017 and even in the high 3%s in 2016. We started 2018 in the low 4%s, but by May the rate had jumped a half-point. Coupled with extreme price jumps from limited inventory, affordability became an issue for many buyers. This started bringing folks to the sidelines.
A large contributor to the growth in our real estate market over the past 6 years was our robust job market, and the employment growth of companies such as Amazon. The “Seattle Head Tax” that passed in mid-May, but then repealed on June 12th, 2018, was a huge threat to our thriving economy. The angst it created in our region about the future of Seattle’s job market was palpable, and had companies like Amazon making bold moves such as halting all current construction projects. Also, we were in the midst of Amazon’s HQ2 search, and the head tax had Seattle on the line in regards to remaining the home to the big employers that have fed our job growth and economic rise.
The combination of a 40% increase in new listings, a half-point rise in interest rates, and the month-long battle over the head tax created pause in our real estate market. With more selection, more expensive money, and the drama in the Seattle City Council, folks were unsure of where we were headed. This created confusion, and when people are not clear they are less likely to make decisions. In retrospect, it was the perfect storm. Like any storm, it changed the environment, and like a washed-out road, we had to find a new route.
The new route, while a bit bumpy and new to navigate, has been refreshing and necessary. For so many years, we have been begging for more inventory to help temper price growth and create more mobility in the market. From 2016 to 2017, we had 14% year-over-year growth in median price in both King and Snohomish counties. To put that in perspective, the average year-over-year appreciation rate over the last 19 years has been 6%. Home values growing at double-digit appreciation rates was unsustainable, and quite frankly not affordable. This balancing-out of the market is a healthy and more sustainable new route.
Year-to-date, Snohomish County’s median price has grown 10% over the previous year and King county, 9%. A large part of that growth happened in the first half of the year, and we have seen some month-over-month prices go down since, as the market starts to find some balance. The media loves to report these month-over-month numbers to create headlines, but buries the big picture of growth over the previous year and the fact that balance is healthy, in the last few paragraphs of any given article.
The mobility that this created has been a welcome change. People were not putting their homes up for sale because they feared the prospect of finding their next one, so they stayed put. The almost overnight increase in selection created a more comfortable environment for the seller who also had to buy their next home. We have even started to see home sale contingency offers come together as this market has started to balance out.
As we round out 2018, in Snohomish County we ended November with two months of inventory based on pending sales, and 2.4 months in King County. This is still a seller’s market, but not the extreme seller’s market that had only two weeks of inventory – and that is a good thing. A balanced market is when you hit four months of inventory, and we have a way to go to get there. Bear in mind that these measurements are of the entire county and do not take price points into consideration. We have seen inventory pile a little higher in the higher price points. The big news is that sellers are sitting on a ton of equity. In Snohomish County, we have seen a 62% increase in median price since 2012, and in King County, 66%. As long as sellers keep this in perspective and understand that pricing needs to reflect the inventory levels, they will find great success.
The opportunity to make a move-up, downsize, or even buy your first home is awesome right now. Selection is actually an option and interest rates are still historically low. Currently, we are hovering around 5%, and they have actually recently dropped. Rates are predicted to head toward the mid 5%s in 2019, making a purchase now very appealing.
If you are just curious about the value of your home in today’s market or you are considering a move in 2019, please reach out. I’d be happy to relate the current market conditions to your investment and your goals. Education and awareness led to clarity, and when one is clear, they are empowered to make strong decisions. It is my mission to help educate my clients and assist them in making these big life decisions. Whatever your goals are in 2019, it is my honor to help keep you informed on all things real estate related.
Why Conserve Water?
There are several compelling reasons to take measures at home to conserve water. Not only will you save money on your utility bill, but conserving water will also help to protect our environment. Reducing how much water we use (and waste) also reduces the energy required to process and deliver it to our homes and businesses. This helps reduce pollution and conserve fuel. Minimizing water use also helps to extend the life of septic systems, and can help avoid costly sewage system expansions.
It’s easy to forget that water is a finite resource, but the stark truth is that only 3% of the water on Earth is fresh water. As populations grow, if we do not protect this precious resource, we may find down the road a lack of adequate, healthy water supply. This would have drastic consequences on water costs, food supplies, and health hazards.
The most effective way to save water is to upgrade your appliances and fixtures. But there are many other ways to reduce the amount of water used at home, most of which do not require any significant investment. Check out this list to get you started. A quick google search will provide even more ideas. Making just a few small changes over the next year can add up to hundreds or even thousands of gallons in water savings!
Where to Celebrate NYE
New Year’s Eve 2018 is almost upon us, and if you are still looking for something to do, read on! There are lots of options in the greater Seattle area, whether you are looking for the biggest blow-out bash or an earlier, family-friendly event.
There are actually two parties that will converge at midnight for the iconic Seattle fireworks show.
The Armory Stage will host rock band SWAY from 8pm until midnight. And at the International Fountain, you can dance the night away with live electronic music and video projection show (starts at 10pm). Tickets are required for both parties, however the big fireworks show is free to enjoy.
The Pacific Science Center transforms on NYE with fire sculptures, drinks and live music. There will be special entertainment throughout the night, as well as the standard Science Center exhibits. At midnight, head outside for the Space Needle fireworks. Purchase tickets in advance.
Watch the Seattle Center fireworks from under the glass of Chihuly Gardens. The evening includes appetizers, desserts, live music and a midnight toast. Purchase tickets in advance.
Another Seattle Center option, the Museum of Popular Culture offers four 21+ parties in one. With live music on three performance stages, comedians, party favors, special VIP areas, more than 20 bars, and a special singles-only cocktail hour, this is one of the largest parties of the year. Museum access is included in the price of the party, purchase tickets in advance.
First Night is an all-ages, family-friendly celebration in Downtown Tacoma’s Theater District. The affordable admission price includes museums, music, art, drama, dance, and a whole day and night of activities. The cost of entry increases as the festival gets closer, so buy early to save!
The perfect NYE celebration if you have older kids, this pajama party features comedians, balloon makers, pizza, snacks, and educational, hands-on activities throughout the night. The fun culminates at 9pm with a ball drop.
Ivar’s on Northlake will host live music, tasty food and view of the fireworks without the crowds. Advanced reservations are required, and will range in price depending on your selections.
Ring in the new year with the latest in R&B, Old School, Jazz and Hip Hop music. This is a 21+, semi-formal event, and hotel packages are available with your ticket purchase.
A Seattle tradition for almost a decade, this 18+ party always brings a mixed crowd together for a night of dancing. This is one of the biggest EDM parties of the year.
Celebrate the coming new year all day at KidsQuest! There are activities every hour from 10am to 4pm, including Bubble Wrap Stomp, New Year’s Hats, Storytime, glittery tattoos, and more. Admission is free with membership or museum admission.
The pressure to come up with resolutions and improvements always mounts near the end of the year, but everyone knows that statistically speaking, most of us won’t stick to our New Year’s resolutions much past February. So rather than give in to societal pressure, guilt, and feelings of hopelessness, I propose a shift in perspective this year.
Rather than viewing the New Year as catalyst for sweeping lifestyle and character changes, let’s instead take this opportunity to renew our sense of purpose and determination. Here are five ideas to make some positive changes in a different way this year.
Express Gratitude
“Gratitude can transform common days into thanksgivings, turn routine jobs into joy, and change ordinary opportunities into blessings.” -William Arthur Ward. You will be amazed at the ways your life will begin to change simply by expressing gratitude regularly. It will help you maintain a fresh perspective day in and day out, and will help to keep stress at bay. Make a list of all the things you are thankful for in your life, big and small. Take some time to really lean in to this list and reflect on each one. Especially focus on why you are thankful for each of those things.
Create a list of things to look forward to
This goes hand-in-hand with gratitude. What are you looking forward to this year? A vacation, a family member getting married, a new restaurant opening, a new novel or a new season of your favorite show. By focusing on the good things coming your way, it will be easier to keep a positive and hope-filled attitude.
Pick a word for the year
Before the year starts, take some time to look at the big picture of the coming year. Find the theme of what you would like to accomplish or focus on, and chose a theme word to guide you. This will give you clarity and focus. Maybe your word for the year is Intentional. Simplify. Peace. Discipline. Fun. When you have your theme word for the year, share it on oneword365.com
Schedule a quarterly retreat
Life happens, and trying to balance work, family, social life, friends, and other commitments often results in very little time for you. Take some time before the new year starts and schedule yourself a quarterly one-day (or weekend!) retreat to focus on YOU. Remember, if you don’t take care of yourself, you won’t be able to take care of anyone else.
Try a 30-day challenge
A 30-day challenge consists of setting a small goal that can be achieved in 30 days, as well as a small, specific action that you will take each day to achieve that goal. For example:
Declutter: every day for 30 days, choose 3 items to donate, sell, give away or throw away.
Random acts of kindness: every day for 30 days, perform a random act of kindness such as: leaving change in a vending machine; buying the coffee of the person behind you at Starbucks; send a thank you email to a coworker who deserves more recognition. Spreading kindness will always come back to you.
New Year’s Eve 2018 is almost upon us, and if you are still looking for something to do, read on! There are lots of options in the greater Seattle area, whether you are looking for the biggest blow-out bash or an earlier, family-friendly event.
There are actually two parties that will converge at midnight for the iconic Seattle fireworks show.
The Armory Stage will host rock band SWAY from 8pm until midnight. And at the International Fountain, you can dance the night away with live electronic music and video projection show (starts at 10pm). Tickets are required for both parties, however the big fireworks show is free to enjoy.
The Pacific Science Center transforms on NYE with fire sculptures, drinks and live music. There will be special entertainment throughout the night, as well as the standard Science Center exhibits. At midnight, head outside for the Space Needle fireworks. Purchase tickets in advance.
Watch the Seattle Center fireworks from under the glass of Chihuly Gardens. The evening includes appetizers, desserts, live music and a midnight toast. Purchase tickets in advance.
Another Seattle Center option, the Museum of Popular Culture offers four 21+ parties in one. With live music on three performance stages, comedians, party favors, special VIP areas, more than 20 bars, and a special singles-only cocktail hour, this is one of the largest parties of the year. Museum access is included in the price of the party, purchase tickets in advance.
Tacoma’s First Night
First Night is an all-ages, family-friendly celebration in Downtown Tacoma’s Theater District. The affordable admission price includes museums, music, art, drama, dance, and a whole day and night of activities. The cost of entry increases as the festival gets closer, so buy early to save!
The perfect NYE celebration if you have older kids, this pajama party features comedians, balloon makers, pizza, snacks, and educational, hands-on activities throughout the night. The fun culminates at 9pm with a ball drop.
New Year’s Eve with Ivar’s Salmon House
Ivar’s on Northlake will host live music, tasty food and view of the fireworks without the crowds. Advanced reservations are required, and will range in price depending on your selections.
Ring in the new year with the latest in R&B, Old School, Jazz and Hip Hop music. This is a 21+, semi-formal event, and hotel packages are available with your ticket purchase.
Resolution New Year’s Eve Party at WAMU Theater
A Seattle tradition for almost a decade, this 18+ party always brings a mixed crowd together for a night of dancing. This is one of the biggest EDM parties of the year.
Celebrate the coming new year all day at KidsQuest! There are activities every hour from 10am to 4pm, including Bubble Wrap Stomp, New Year’s Hats, Storytime, glittery tattoos, and more. Admission is free with membership or museum admission.
♦ Buttonwood Farm
14500 NE 116th St, Redmond
100% organic you-cut or white-glove delivery service, saws provided, hot chocolate and cookies
♦ Carnation Tree Farm
31523 NE 40th St, Carnation
You-cut trees, pre-cut trees, wreaths, garlands, mistletoe, Santa visits, Christmas decorations, trees baled, saws provided, hay rides
♦ Cedar Falls Tree Farm
15200 Cedar Falls Rd SE, North Bend
You-cut trees, wreaths, trees bagged & tied, saws provided, free hot cider, picnic area, porta-potties
♦ Christmas Creek Tree Farm
15515 468th Ave SE, North Bend
You-cut trees, pre-cut trees, trees baled, refreshments, hay rides, Santa on weekends, picnic areas
♦ Coates Christmas Trees
17225 SE Green Valley Road, Auburn
You-cut trees, pre-cut trees, wreaths, boughs, garlands, mistleto, Santa, trees bagged and tied
♦ Country Tree Farm
18225 116th Ave SE, Renton
You-cut trees, wreaths, holly, refreshments, Santa
♦ Crown Tree Farm
13005 424th Ave SE, North Bend
You-cut trees, pre-cut trees, wreaths and boughs, decorations, saws provided, trees bagged, free tree trimmings
♦ Crystal Creek Tree Farm
23604 SE 192nd St, Maple Valley
You-cut trees, saws provided, trees baled, cider, porta-potties
♦ Enchanted Winds Tree Farm
8021 Issaquah-Hobart Rd, Issaquah
You-cut trees, wreaths, swags, boughs, holly, gifts, decorations, crafts, trees baled, tree stands, hay wagon, trailer rides, fire pit, hot beverages
♦ Hunter Farms Fresh Cut Trees
7744 35th Ave NE, Seattle
Precut trees, mistletoe, holly, wreaths, flocking, restrooms, trees baled, fire retarding
♦ Keith and Scott Tree Farm
42999 SE 120th St, North Bend
You-cut trees, pre-cut trees, wreaths, boughs, trees tied, baled and trimmed, saws provided, bonfires, refreshments, restrooms
♦ Serres Farm
20306 NE 50th St, Redmond
You-cut trees, pre-cut trees, saws provided, wreaths, free hot chocolate, restrooms
♦ Snow Valley Christmas Tree Farm
17651 W Snoqualmie River Rd NE, Duvall
You-cut trees, pre-cut trees, wreaths, Santa appearances, decorations, free hot beverages, gift shop, porta-potties
Snohomish County:
♦ Bowen Tree Farm
19301 95th Ave NE, Arlington
You-cut trees, wreaths, decorations, free hot cider, gift shop, porta-potties
♦ Farmer Brown’s Tree Farm
12017 109th Ave NE, Arlington
You-cut trees, saws provided, hot beverages, flocking, gift shop, restrooms
♦ Hemstrom Valley Tree Farm
4329 Robe Menzel Road, Granite Falls
You-cut trees, saws provided, winter events, refreshments
♦ Holiday Forest
3125 280th St NW, Stanwood
You-cut trees, wreaths, boughs, saws provided, winter wagon rides, snacks and refreshment stand
♦ Lochsloy Acres
5511 State Route 92, Lake Stevens
You-cut trees, wreaths, boughs, saws provided, free coffee, cider & hot chocolate
♦ Paterson’s Lazy Acres Tree Farm
1315 188th St NE, Arlington
You-cut trees, saws provided, trees baled, wreaths, decorations, refreshments
♦ Wintergreen Tree Farm
13606 S Machias Rd, Snohomish
Precut trees, you choose and you cut trees, wreaths, boughs, garlands, decorations, Christmas festival, bonfires, free hot cider, gift shop, restrooms
Remember to always call the farm before you go to confirm their supply, hours, if they are allowing choose-and-cut or just pre-cut trees, and which attractions or winter activities are available. All of these things can change quickly during the short Christmas season due to weather, demand, and the farmers business conditions!
With a healthy increase in inventory since May, the need for buyers to have all their down payment funds immediately available, and a willingness to make offers with no contingencies has passed in most cases. It has been quite a relief, and is providing opportunities for many folks that have wanted to cash in on their well-developed equity levels, and either move up to a bigger home or down size (right size) to a home that better fits their current lifestyle.
For the first time in years we are starting to see an increase in contingent offers that are turning into pending transactions. A contingent sale is one where a buyer makes an offer to purchase their next home contingent on the sale of their current home. In some cases, the buyer’s current home may be already on the market, or in other cases they still need to launch their home to the market. Many buyers in this situation wait to find a home/seller that is willing to accept their contingent offer, and then they immediately launch their home onto the market.
The goal is a sale within 30-45 days, which will then provide the buyer with their down payment funds, and then close both properties within days of each other, making a smooth transition from one house to the next. We have not seen inventory levels the way they are now since late 2014, so the opportunity for successfully executing a contingent offer has not been an option for 4 years! It is a great time to seize this opportunity. With that said, let’s look at some statistics which highlight some of the gains there are to be had.
First and foremost, let’s look at year-over-year price appreciation. Over the last 12 months, we have seen an 11% increase in prices in both King and Snohomish Counties. Last year, the year-over-year price appreciation was 14% for both counties. This illustrates that price appreciation is slowing, or softening, if you will, due to the increase in inventory levels. This is a welcome trend as we move away from unsustainable appreciation levels, which is helping to stabilize affordability. Bear in mind that a historically-normal appreciation rate is 3-5%, so we are still a ways away from reaching that baseline.
The current market environment for both counties is still a seller’s market, sitting at 2.6 months of inventory based on pending sales for King, and 2.3 for Snohomish. A balanced market is representative of 3-6 months on inventory; we are currently just under that, but well above the extreme 0.5-0.8 months that we experienced over the last year or so. This has created more selection, which has minimized multiple offers and given buyers the opportunity to write offers with more comfortable terms, such as a home sale contingency.
Lastly, let’s talk interest rates! Currently, they are hovering around 5%. Yes, this is up from the 4.5% we saw earlier this year, but still well below the 30-year historical average of 6.7%. Money is still relatively cheap to borrow, and this should be taken advantage of as experts predict interest rates to rise as we head into 2019 and beyond. Your interest rate is typically fixed for the life of your loan, so rate plays into the long-term savings you can have on your asset if locked in at today’s levels.
If you have thought about making a move to a home that is a better fit for your current lifestyle, but have been stalled because you weren’t sure how to do it, now is the time to consider your options. Please reach out if you’d like a review of the current market conditions and how they relate to your goals. It is my goal to help keep my clients informed and empower strong decisions.
Choosing a color palette for your home can be a complex process. Whether you are refreshing the interior or exterior, identifying colors that you relate to and that are on trend can be a challenge. Check out this article from House Beautiful on the most popular color palettes for 2019 based on your color personality. I think there is a lot of fun to be had here, and remember – a couple coats of paint can be the most inexpensive way to refresh your home. If you need a painter or any other contractor, remember that I can be a resource, as I have a preferred contractors list that I can pull from.
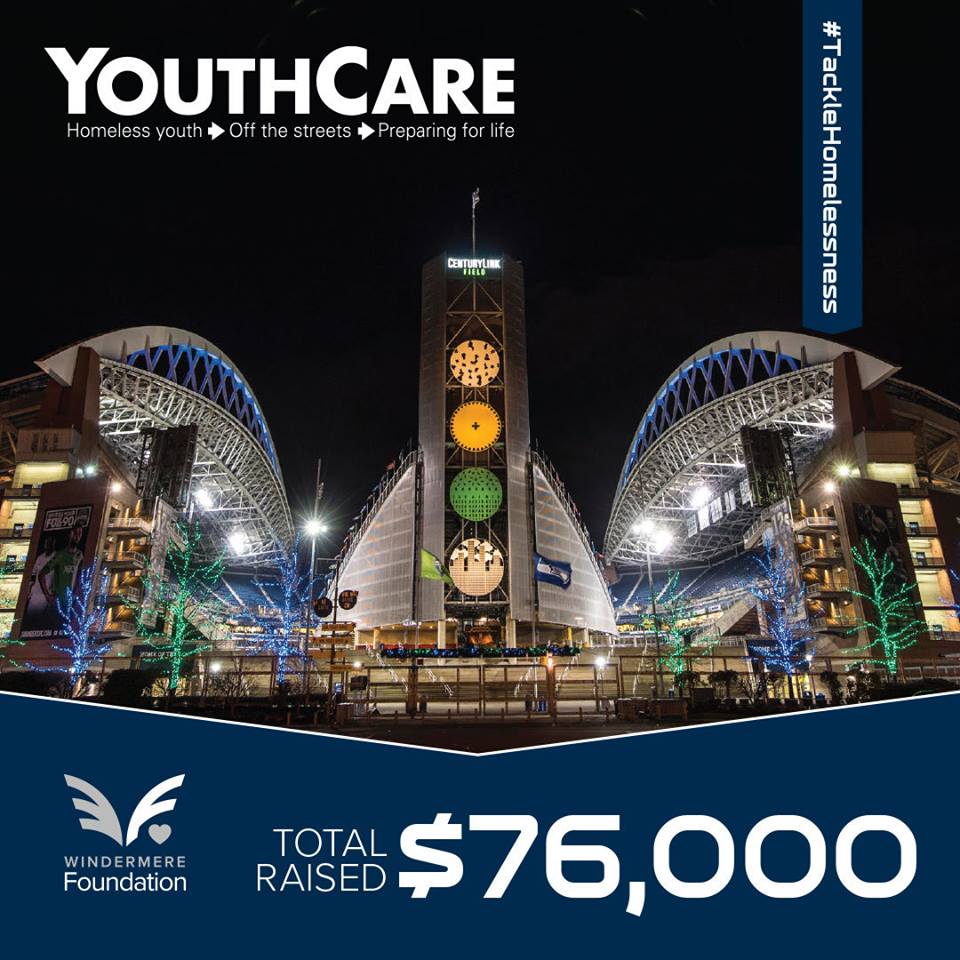
#TackleHomelessness
Every play matters in the fight against homelessness! Congratulations to the Seattle Seahawks for helping us raise $4,600 to #TackleHomelessness in their last home game against Los Angeles. That brings our season total to $9,200 and our cumulative money raised to $76,000! Good luck to the Hawks this weekend against the Chargers!
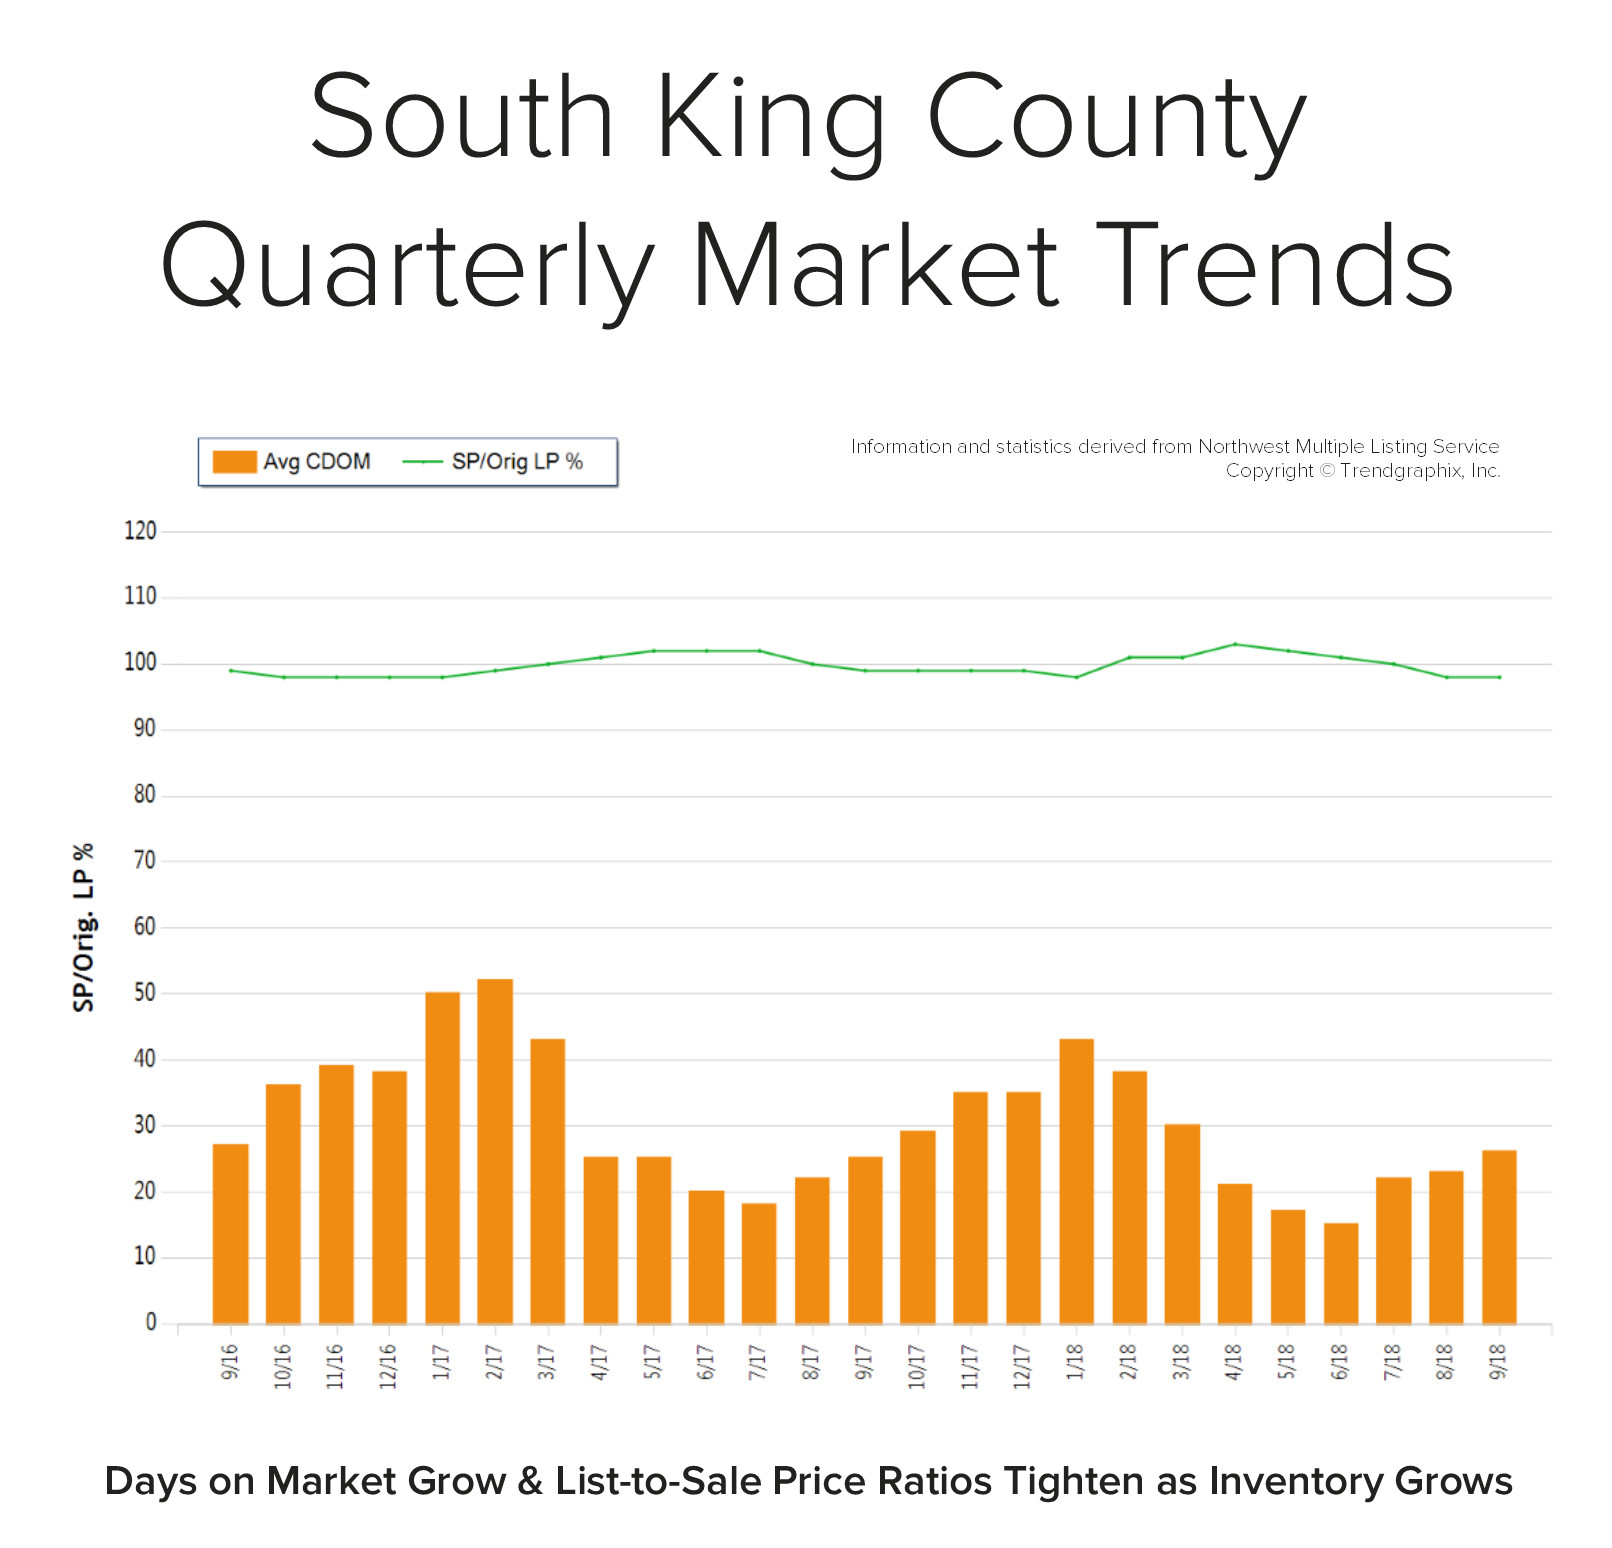
In September, the average days on market landed at 26 days and the original list-to-sale price ratio 98%. Since May, inventory growth has been noticeable, and has given buyers more options. This has led to more negotiations and fewer bidding wars, which is tempering month-over-month price growth to a more sustainable level. Back in April, the average days on market was 21 days and the original list-to-sale price ratio 103%; but months of inventory based on pending sales was 0.9 months, compared to 2.6 months currently. Year-over-year, prices are up 10%, still well above the historical norm of 3%-5% year-over-year gains—but note that the majority of this growth happened during the spring, due to constricted inventory levels.
Supply has increased, creating more options for buyers and helping to buffer affordability issues. Many sellers are deciding to make moves and cash in on the equity gained over the last six years. An average original list-to-sale price ratio of 98% is a positive return, yet illustrates a softening in the market after some very extreme times. With 10% price growth over the last 12-months in a seller’s favor, the increase in selection has led to more nimble moves from one house to another. Where sellers need to be careful is anticipating the month-over-month price growth we saw prior to the shift in inventory. Prospective buyers would be smart to take advantage of today’s historically low interest rates and the added inventory selection.
This is only a snapshot of the trends in south King County; please contact me if you would like further explanation of how the latest trends relate to you.

 Facebook
 X
X
 Pinterest
 Copy Link
 2018 was a year of change and growth. The market shifted from an extreme seller’s market, but still had strong gains. Year-over-year, median price is up 9% and since 2012 has increased 93%! Over the last 19 years, the average year-over-year price increase has been 6%. This puts into perspective the growth we have experienced, resulting in well-established equity levels. In 2018, inventory averaged 1.5 months, double that of 2017. This caused the month-over-month price gains to slow, and we experienced a price correction over the second half of the year. We expect to see more average levels of price appreciation in 2019 as the market continues to balance out.
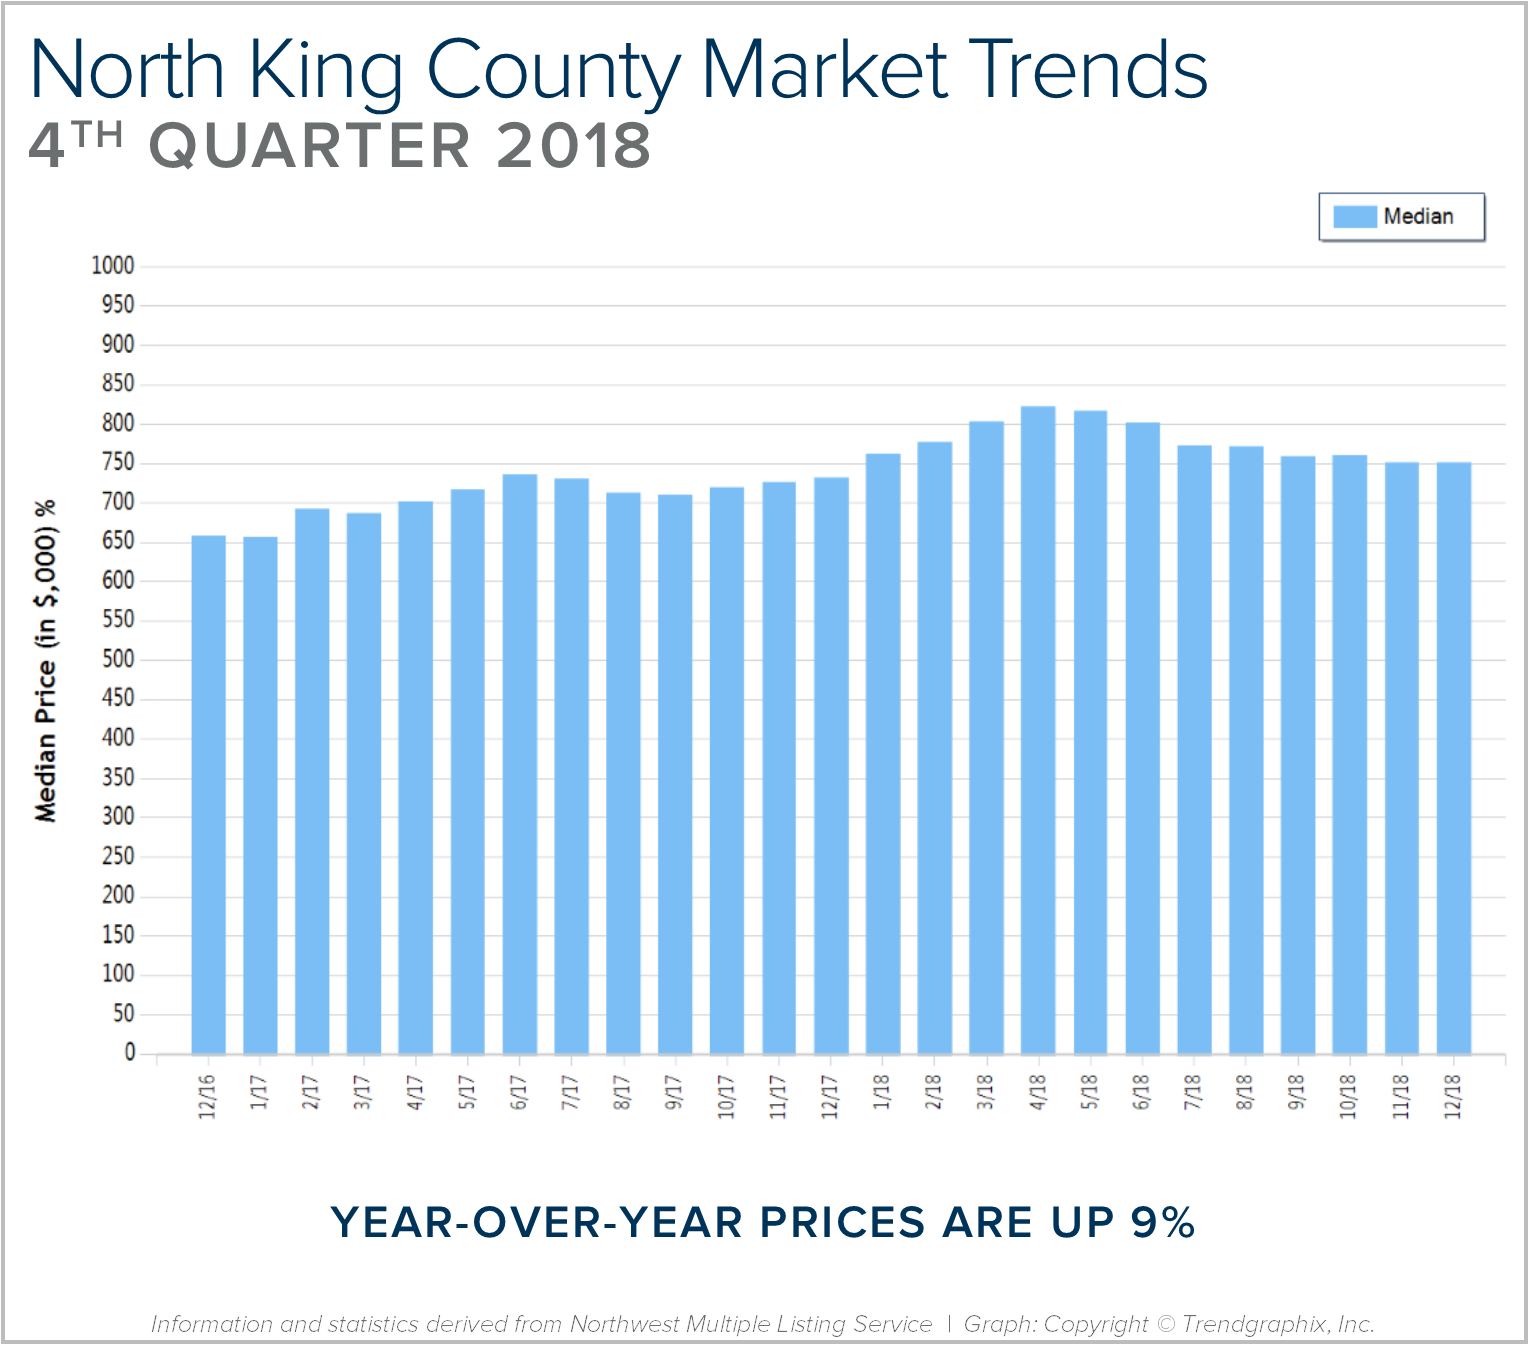
 2018 was a year of change and growth. The market shifted from an extreme seller’s market, but still had strong gains. Year-over-year, median price is up 9% and since 2012 has increased 92%! Over the last 19 years, the average year-over-year price increase has been 6%. This puts into perspective the growth we have experienced, resulting in well-established equity levels. In 2018, inventory averaged 1.5 months, double that of 2017. This caused the month-over-month price gains to slow, and we experienced a price correction over the second half of the year. We expect to see more average levels of price appreciation in 2019 as the market continues to balance out.
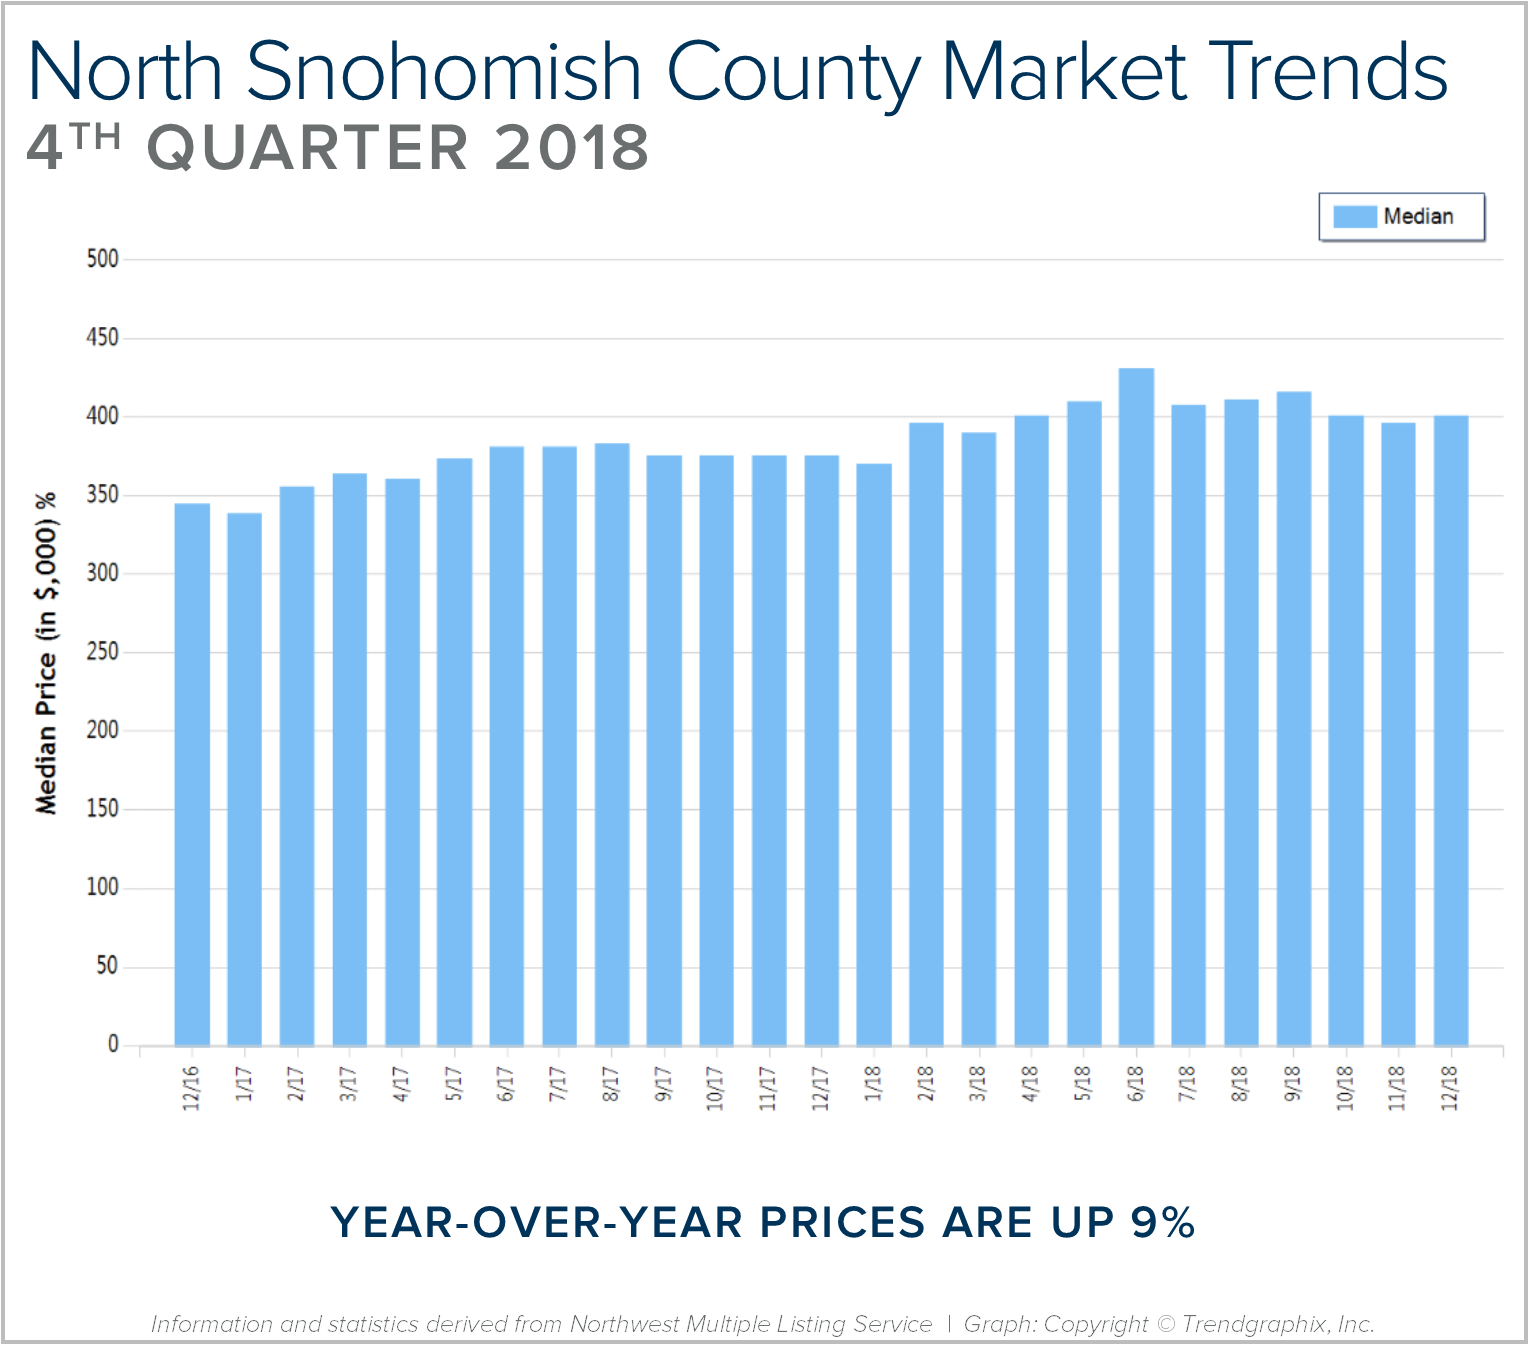
 2018 was a year of change and growth. The market shifted from an extreme seller’s market, but still had strong gains. Year-over-year, median price is up 9% and since 2012 has increased 88%! Over the last 19 years, the average year-over-year price increase has been 6%. This puts into perspective the growth we have experienced, resulting in well-established equity levels. In 2018, inventory averaged 1.6 months, higher than 2017. This caused the month-over-month price gains to slow, and we experienced a price correction over the second half of the year. We expect to see more average levels of price appreciation in 2019 as the market continues to balance out.
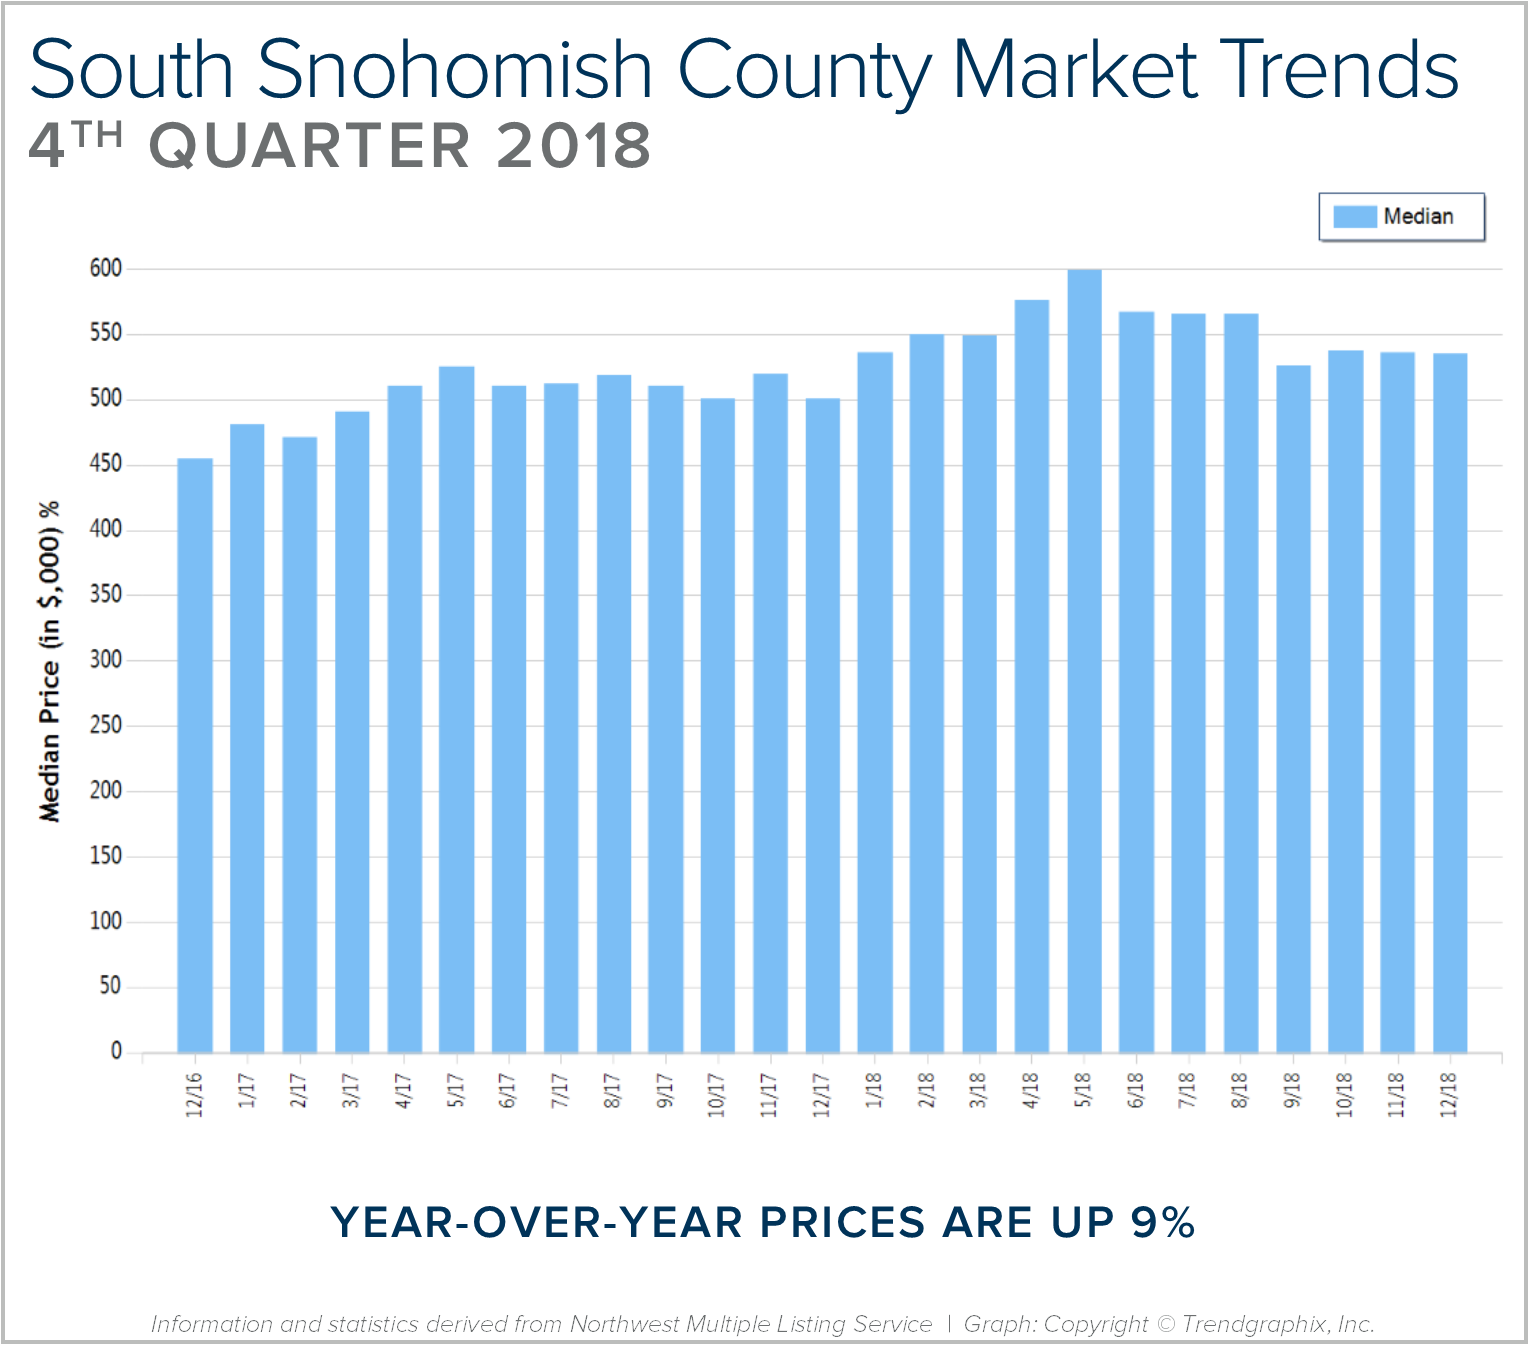
 2018 was a year of change and growth. The market shifted from an extreme seller’s market, but still had strong gains. Year-over-year, median price is up 9% and since 2012 has increased 85%! Over the last 19 years, the average year-over-year price increase has been 6%. This puts into perspective the growth we have experienced, resulting in well-established equity levels. In 2018, inventory averaged 1.5 months, double that of 2017. This caused the month-over-month price gains to slow, and we experienced a price correction over the second half of the year. We expect to see more average levels of price appreciation in 2019 as the market continues to balance out.


 With a healthy increase in inventory since May, the need for buyers to have all their down payment funds immediately available, and a willingness to make offers with no contingencies has passed in most cases. It has been quite a relief, and is providing opportunities for many folks that have wanted to cash in on their well-developed equity levels, and either move up to a bigger home or down size (right size) to a home that better fits their current lifestyle.
 In September, the average days on market landed at 26 days and the original list-to-sale price ratio 98%. Since May, inventory growth has been noticeable, and has given buyers more options. This has led to more negotiations and fewer bidding wars, which is tempering month-over-month price growth to a more sustainable level. Back in April, the average days on market was 21 days and the original list-to-sale price ratio 103%; but months of inventory based on pending sales was 0.9 months, compared to 2.6 months currently. Year-over-year, prices are up 10%, still well above the historical norm of 3%-5% year-over-year gains—but note that the majority of this growth happened during the spring, due to constricted inventory levels.