Kick off the holiday season with a community tree lighting celebration. Thanksgiving falls late on the calendar this year, so the Christmas festivities will be right on it’s heels. Some of these celebrations start as early as the day after Thanksgiving!
The bigger celebrations feature Santa’s arrival, and most of the communities will have fun activities designed to put you and your family in the holiday spirit. live music, refreshments, crafts, and other fun activities. Santa will make an appearance at most of these as well.
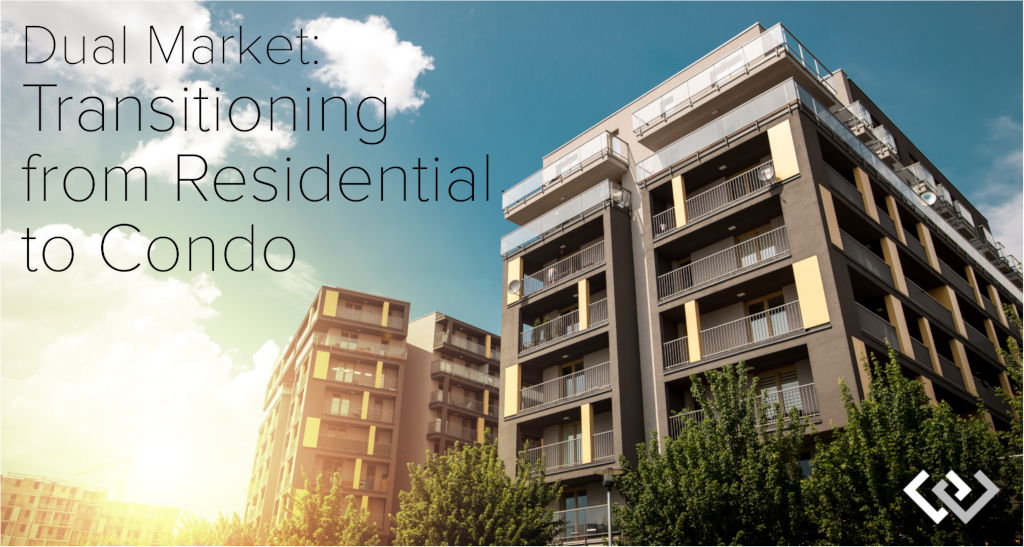
Last month, I did an analysis on the new phenomenon of a dual market. A dual market is when you have different market conditions within the same overarching real estate market. This duality presents amazing opportunities for sellers who are also buyers, depending on where they want to go. I reported on two dual markets, the move-up market and the move-out market. Another dual market that deserves to be shared is the condo market compared to single-family residential.
In September, single-family residential homes in Seattle Metro had an absorption rate of 43% while condos were at 27%. Months of inventory based on pending sales for single-family residential was only 1.9 months of available inventory, and condos, 3.5 months! That is the difference of a seller’s market for single-family residential to a balanced market for condos. After many solid years of strong appreciation, folks that are looking to cash out the equity on their single-family residential homes and move to a condo have the opportunity to move their investment with a sizable down payment and upgrade to a lifestyle that is often stair-free with less maintenance.
The median price for a condo in Seattle Metro in September was $455,000 and for a single-family residential home, $750,000. The median price for a condo in south Snohomish County is September was $343,000 and for a single-family residential home, $569,000. It is common for folks to sell their long-time family home and downsize into a condo and pay all cash. The buildup of equity over the years and paying down their loans allow for large cash-outs and easier all-cash purchases.
If one is getting a loan though, it is important to highlight today’s interest rates. They are a point lower than they were a year ago, affording buyers 10% more buying power. For example, a one-point-lower rate on a purchase at $500K will now afford a buyer the purchase of a home at $550K with the same monthly payment. Couple that with price appreciation tempering and you have a perfect downsizing market, which often includes condo purchases!
If you are curious about moving from a single-family home to a condo and the opportunity this dual market presents, please reach out. It is my goal to help keep my clients educated and empowered to make strong decisions. This is especially rewarding when it leads to their next chapter in life, which are amazing transitions to be a part of.
Did you know that giving thanks on a daily basis can reduce your trips to the doctor, increase your overall happiness, improve personal relationships, and lead to more exercise? Sounds like a magic pill to me, and it’s free! Harvard Medical School recently released a study that speaks to the benefits of practicing gratitude. With Thanksgiving approaching, challenge yourself to write down your gratitudes daily, and see how it goes.
It’s true! A listing agent’s goal is to get their listing sold to a qualified buyer who will close. However, a good listing agent also realizes that once a home is under contract, they now have to sell the house to the appraiser if the buyer is getting a loan. You see, a buyer cannot complete their financing if the appraisal does not come in at the same value or higher than the agreed-upon contract price. A good strategy, especially if the price escalates above the list price, is for the listing agent to prepare an appraisal packet and meet the appraiser or share it with them via email. This gives the listing agent the opportunity to share their research and the story of the demand surrounding the property. This is some extra effort, but so worth it to ensure success for the seller!
Increased pending activity is an indication of strong buyer demand which is very much being driven by historically low interest rates, a thriving job market, and an overall strong local economy. In fact, interest rates are an entire point lower than they were a year ago! This affords buyers a price point that is 10% higher over last year while maintaining the same monthly payment. A year ago, the monthly payment for a home at $500,000 is the same for a home at $550,000 today. Today’s rates coupled with tempered price appreciation provides increased affordability for buyers, which in turn is providing a healthy audience for sellers. After many years of strong price increases, many sellers are moving their equity to the next lifestyle home they desire.
This is only a snapshot of the trends in south King County; please contact me if you would like further explanation of how the latest trends relate to you.
Increased pending activity is an indication of strong buyer demand which is very much being driven by historically low interest rates, a thriving job market, and an overall strong local economy. In fact, interest rates are an entire point lower than they were a year ago! This affords buyers a price point that is 10% higher over last year while maintaining the same monthly payment. A year ago, the monthly payment for a home at $450,000 is the same for a home at $495,000 today. Today’s rates coupled with tempered price appreciation provides increased affordability for buyers, which in turn is providing a healthy audience for sellers. After many years of strong price increases, many sellers are moving their equity to the next lifestyle home they desire.
This is only a snapshot of the trends in north Snohomish County; please contact me if you would like further explanation of how the latest trends relate to you.
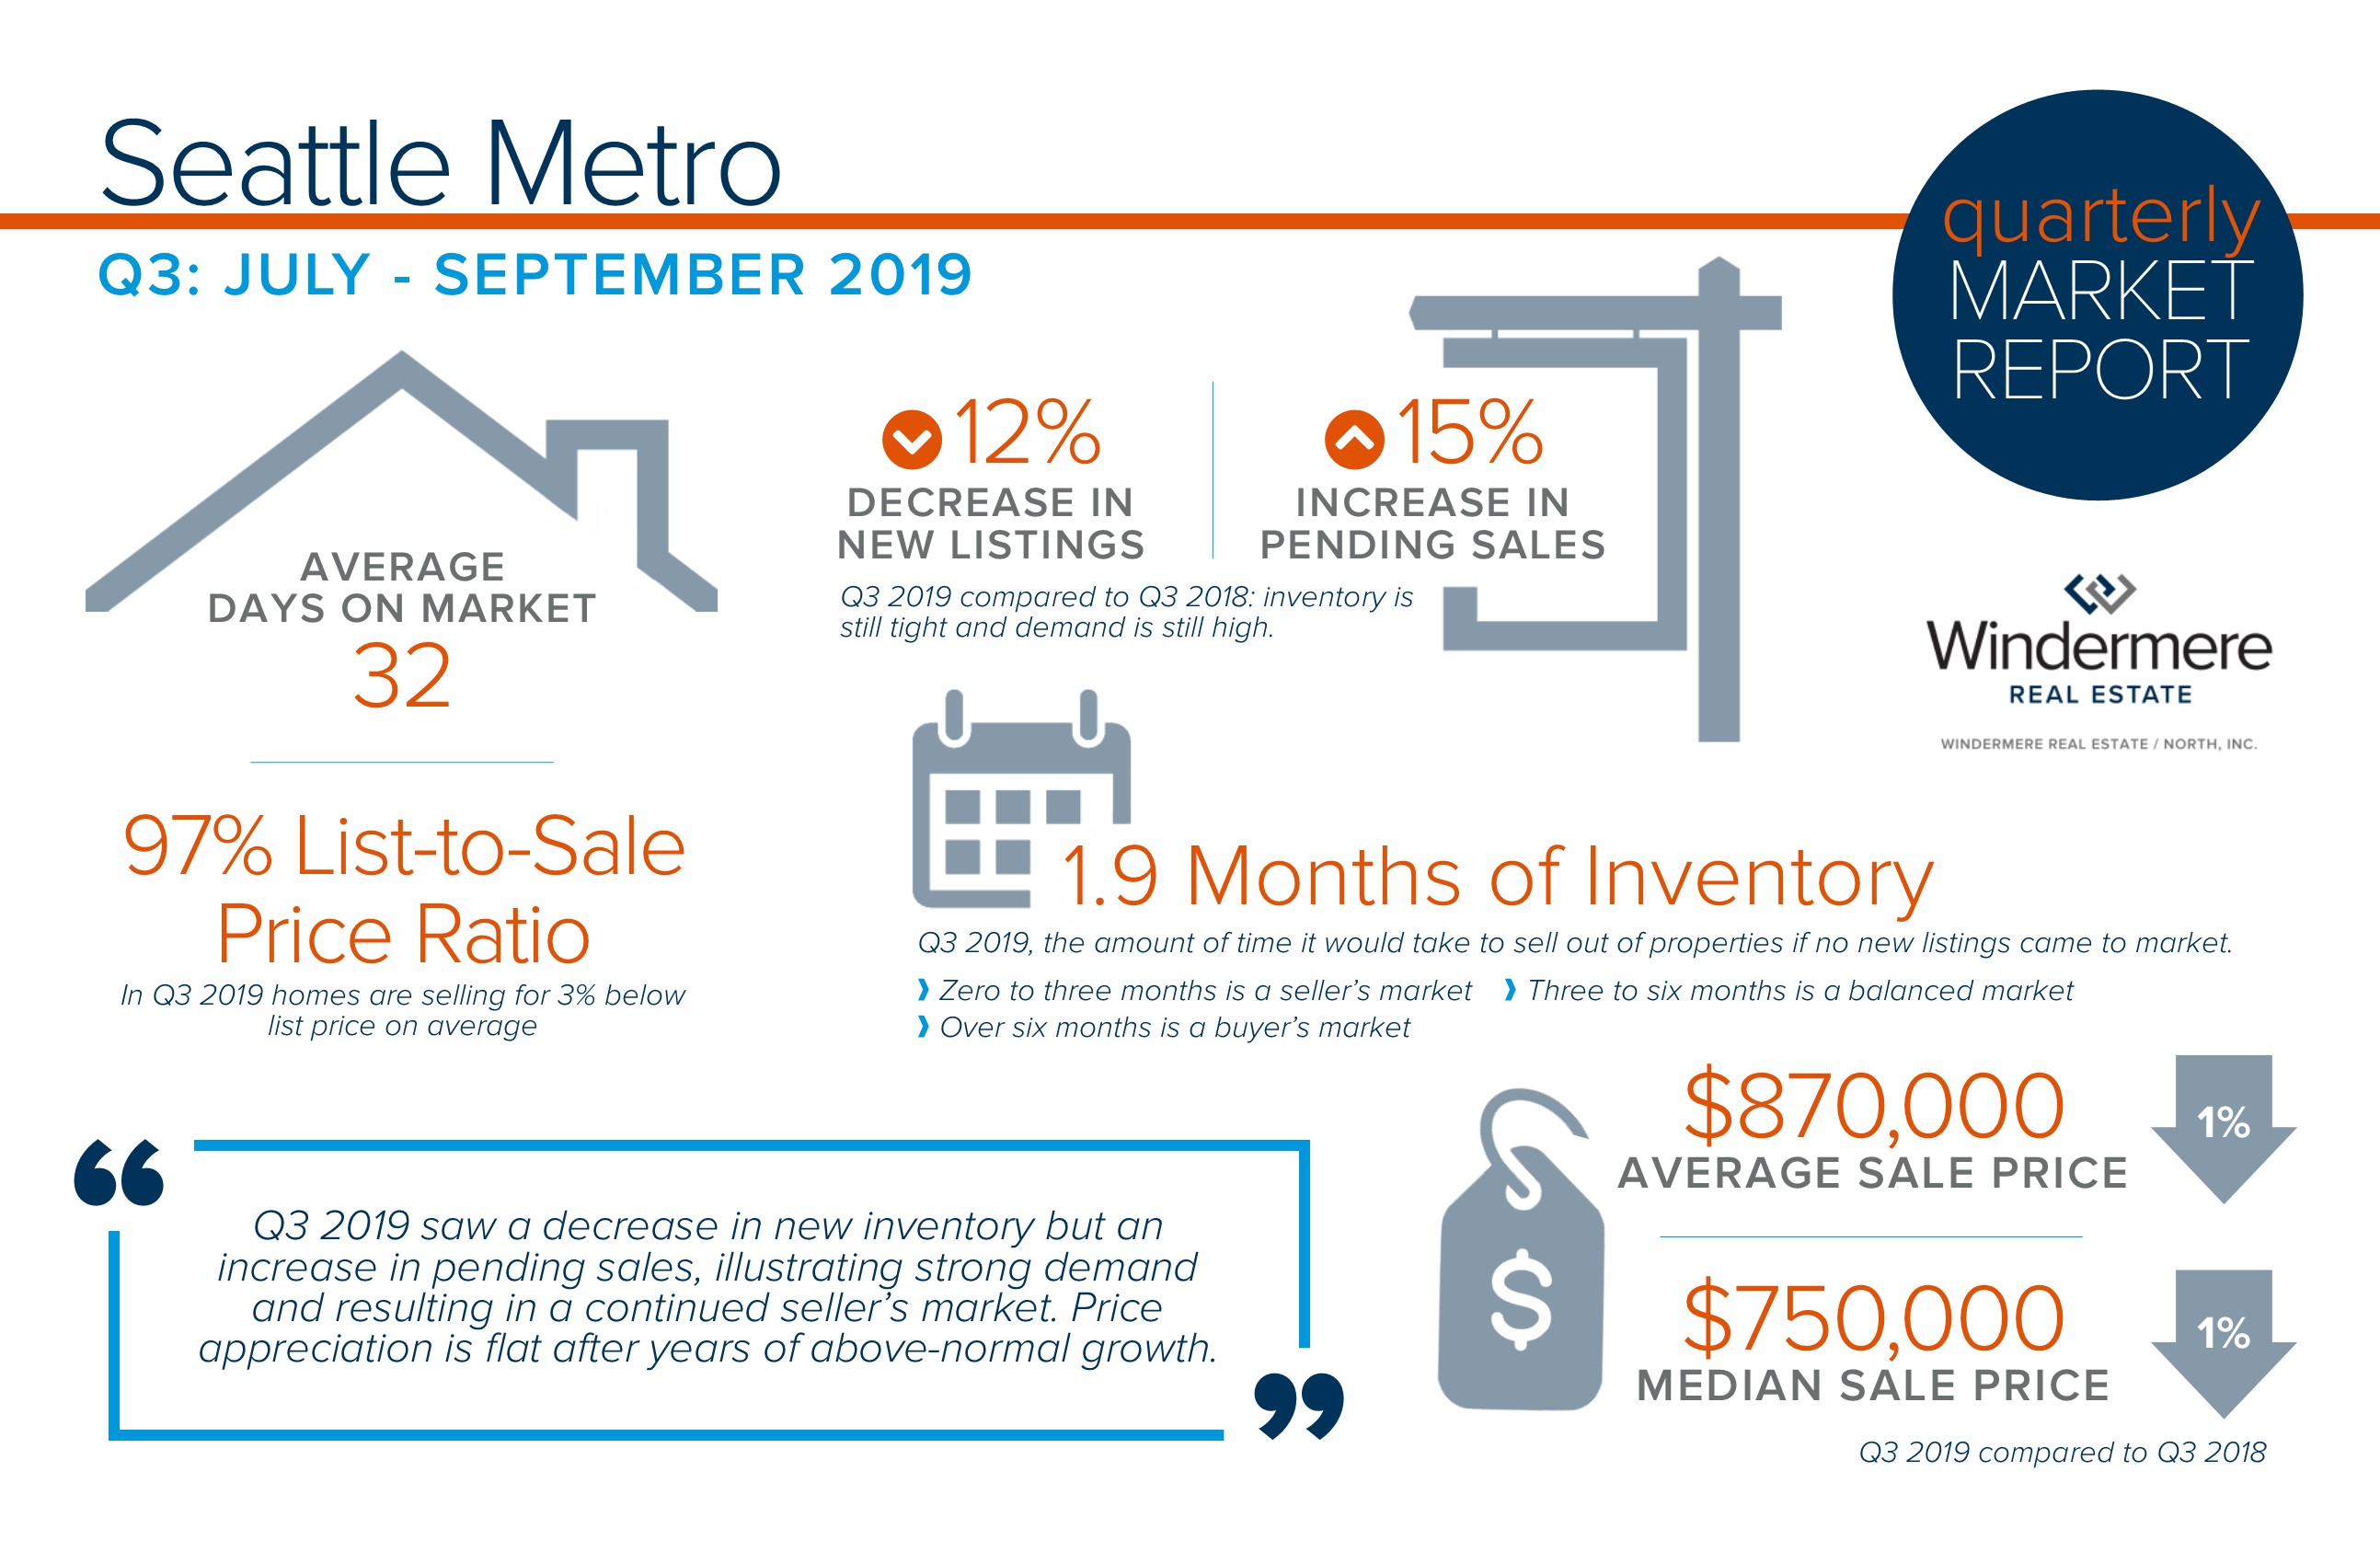
Increased pending activity is an indication of strong buyer demand which is very much being driven by historically low interest rates, a thriving job market, and an overall strong local economy. In fact, interest rates are an entire point lower than they were a year ago! This affords buyers a price point that is 10% higher over last year while maintaining the same monthly payment. A year ago, the monthly payment for a home at $750,000 is the same for a home at $825,000 today. Today’s rates coupled with tempered price appreciation provides increased affordability for buyers, which in turn is providing a healthy audience for sellers. After many years of strong price increases, many sellers are moving their equity to the next lifestyle home they desire.
This is only a snapshot of the trends in the Seattle Metro area; please contact me if you would like further explanation of how the latest trends relate to you.
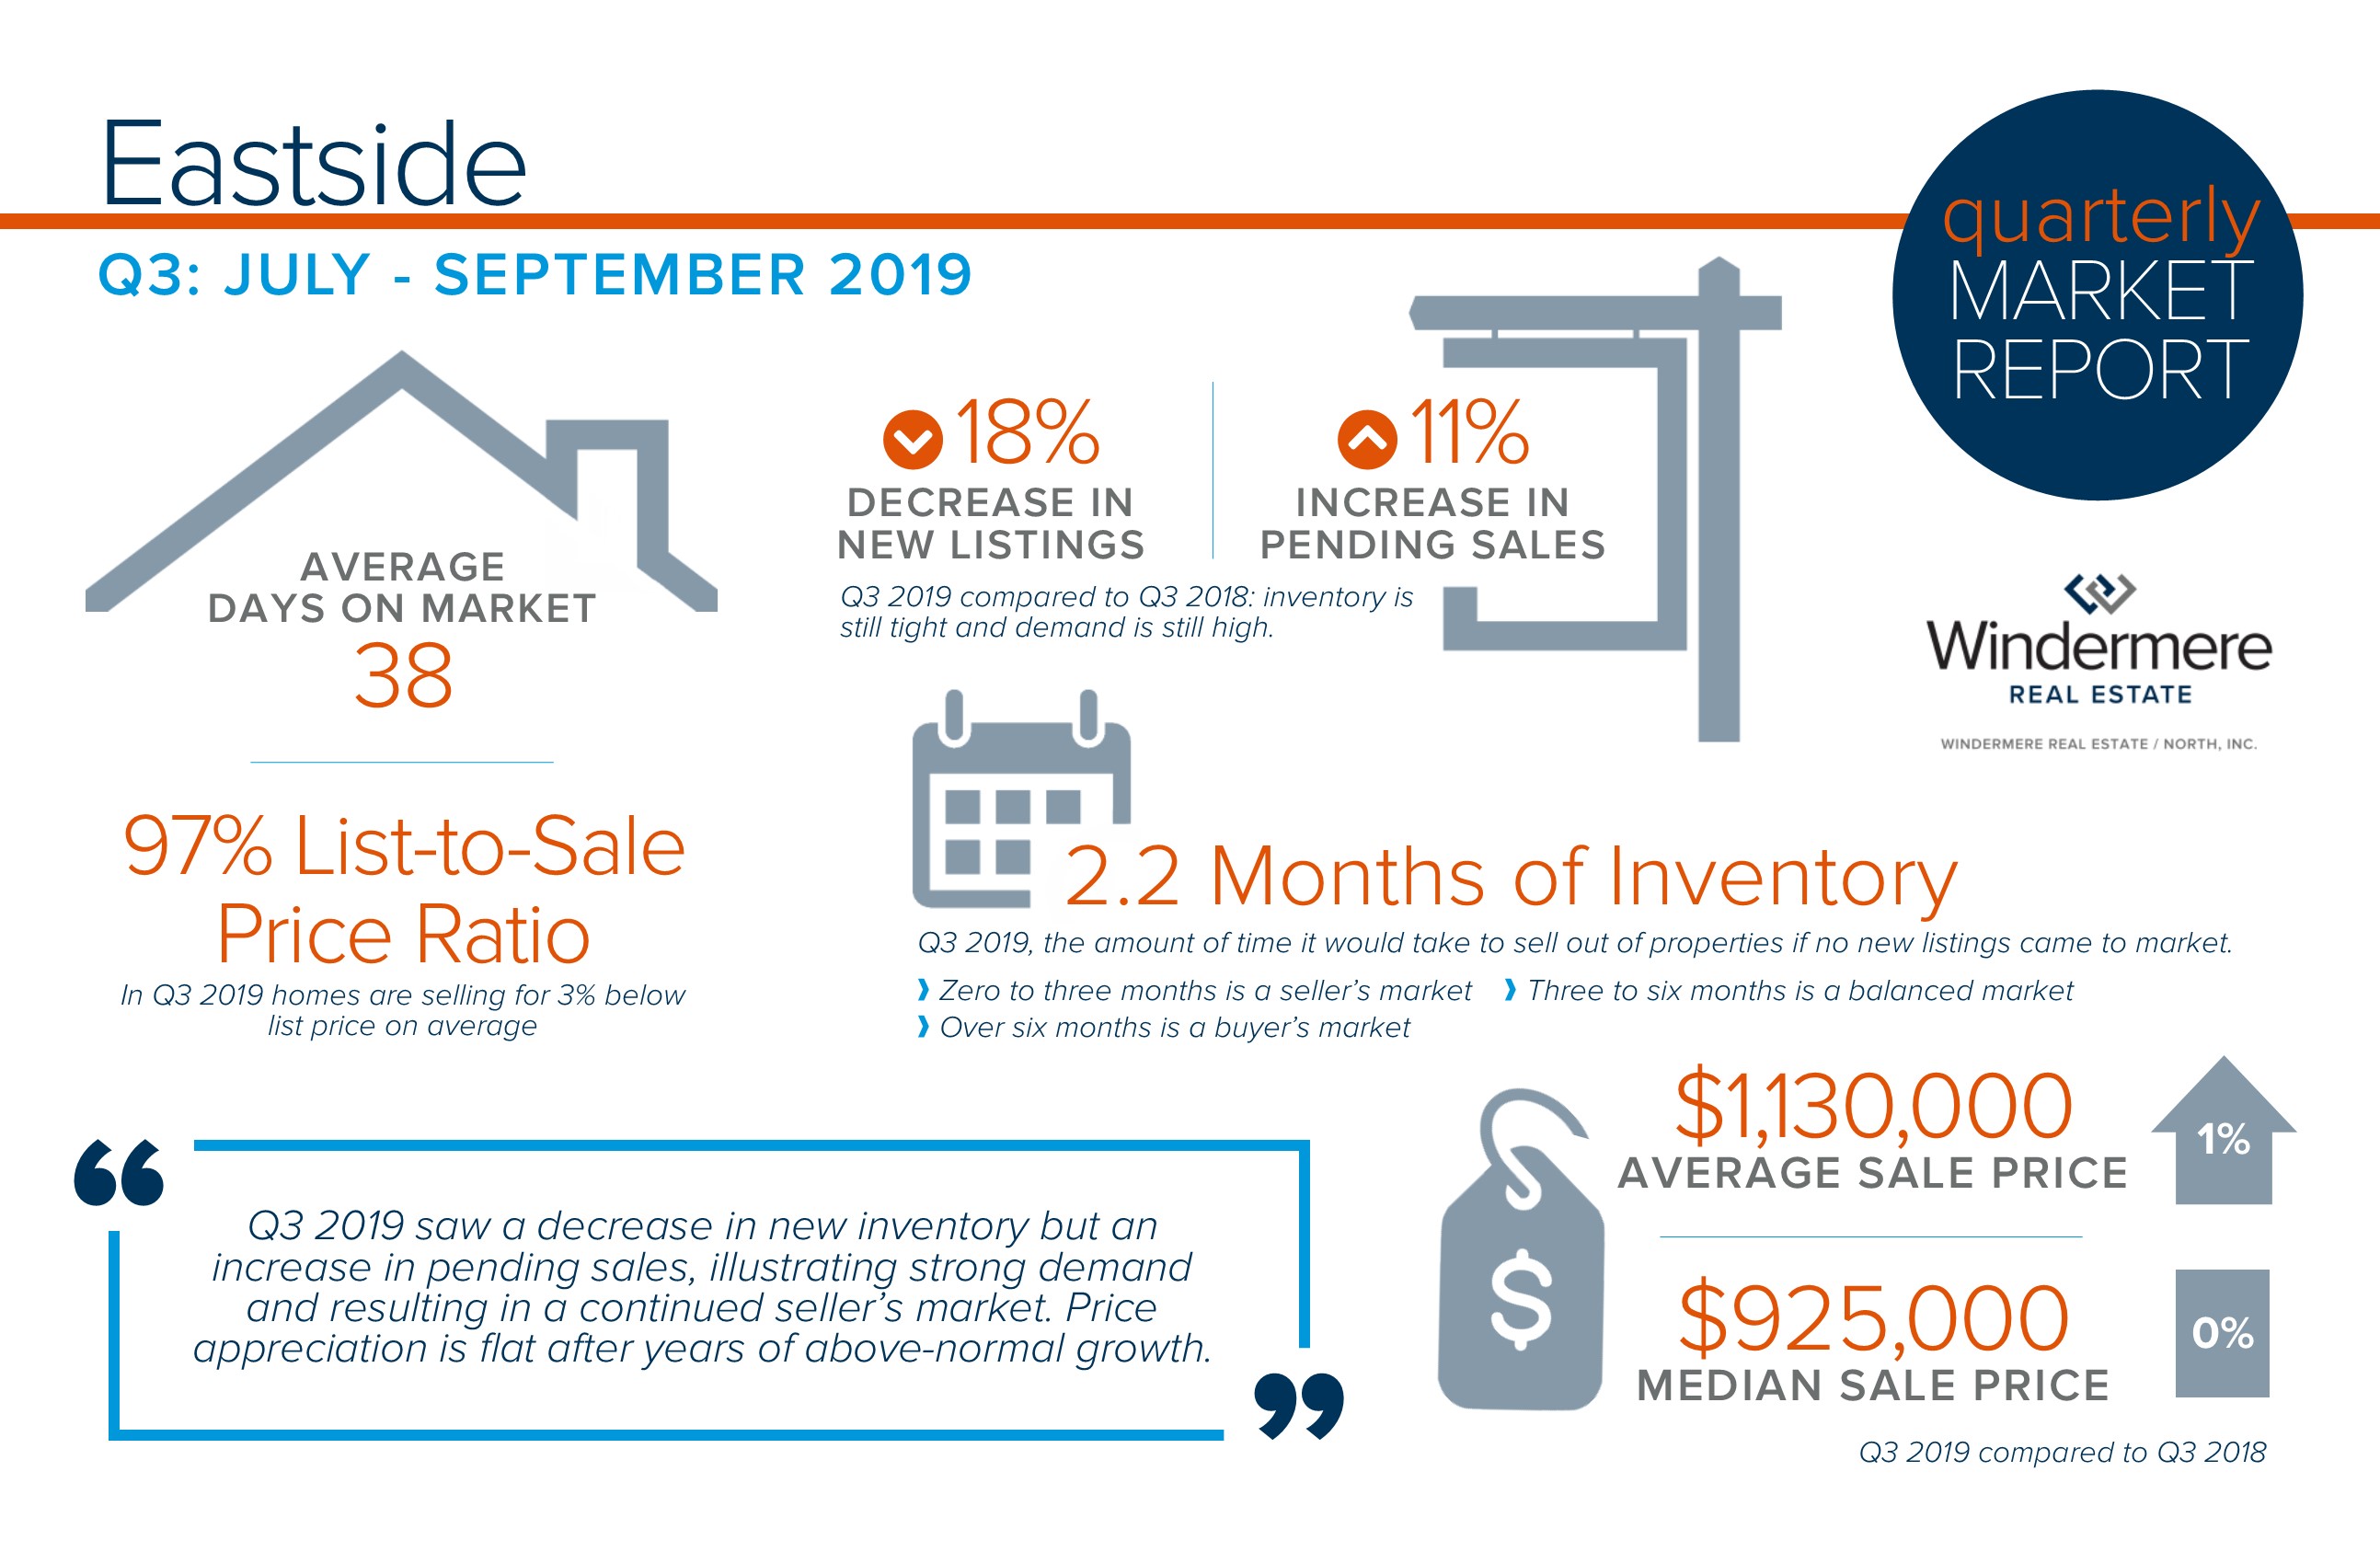
Increased pending activity is an indication of strong buyer demand which is very much being driven by historically low interest rates, a thriving job market, and an overall strong local economy. In fact, interest rates are an entire point lower than they were a year ago! This affords buyers a price point that is 10% higher over last year while maintaining the same monthly payment. A year ago, the monthly payment for a home at $900,000 is the same for a home at $990,000 today. Today’s rates coupled with tempered price appreciation provides increased affordability for buyers, which in turn is providing a healthy audience for sellers. After many years of strong price increases, many sellers are moving their equity to the next lifestyle home they desire.
This is only a snapshot of the trends on the Eastside; please contact me if you would like further explanation of how the latest trends relate to you.
Increased pending activity is an indication of strong buyer demand which is very much being driven by historically low interest rates, a thriving job market, and an overall strong local economy. In fact, interest rates are an entire point lower than they were a year ago! This affords buyers a price point that is 10% higher over last year while maintaining the same monthly payment. A year ago, the monthly payment for a home at $750,000 is the same for a home at $825,000 today. Today’s rates coupled with tempered price appreciation provides increased affordability for buyers, which in turn is providing a healthy audience for sellers. After many years of strong price increases, many sellers are moving their equity to the next lifestyle home they desire.
This is only a snapshot of the trends in north King County; please contact me if you would like further explanation of how the latest trends relate to you.
Increased pending activity is an indication of strong buyer demand which is very much being driven by historically low interest rates, a thriving job market, and an overall strong local economy. In fact, interest rates are an entire point lower than they were a year ago! This affords buyers a price point that is 10% higher over last year while maintaining the same monthly payment. A year ago, the monthly payment for a home at $550,000 is the same for a home at $605,000 today. Today’s rates coupled with tempered price appreciation provides increased affordability for buyers, which in turn is providing a healthy audience for sellers. After many years of strong price increases, many sellers are moving their equity to the next lifestyle home they desire.
This is only a snapshot of the trends in south Snohomish County; please contact me if you would like further explanation of how the latest trends relate to you.
We all know that nothing lasts forever, but when everything is working fine it is easy to forget that all of the systems and appliances in your home have a finite lifespan. Keep this information in mind, whether you are buying or selling a home, budgeting for improvements, or deciding between repairing and replacing.
ROOFING, SIDING, WINDOWS & DECKS. You can expect slate or tile roofs to last around 50 years, wood shingles 25-30, metal will get you about 25 years, while asphalts typically last about 20 years. The lifespan for siding can vary quite a bit. Brick will last 100 years or more, aluminum about 80 years and stucco will probably last you 25 years. Wood siding can last anywhere from 10 to 100 years depending on the climate you live in and how it is maintained. Both aluminum and vinyl windows will last 15 to 20 years, while unclad wood windows can have a life of 30 years or more. Cedar decks will average 15-25 years as long as they are properly treated and cleaned, and a high quality composite deck will last 30 years with minimal maintenance.
FLOORING. The natural flooring materials such as wood, marble, slate or granite will all last 100 years or more, while tile has an average life of 70-100 years. Vinyl can last up to 50 years, while laminate and linoleum will get you up to 25 years. Expect your carpet to last 8-10 years, depending on use.
KITCHEN & BATH. Laminate countertops can have a life of 20 years or more, but it will vary depending on use. Wood, tile and stone should last a lifetime, and cultured marble will typically see a lifespan of 20 years. You can expect your stainless steel sink to last you about 30 years, while an enamel-coated sink will give you five to 10 years. Slate, granite, soapstone and copper will be around for 100 years or more. Bathroom faucets should give you about 20 years, and toilets will average a 50-year lifespan, although some of the parts will need replacing.
APPLIANCES. The lifespan of appliances will vary widely depending on the appliance, the brand, model, and use. Use these average lifespan numbers as a rough guide for when it may make more sense to replace rather than repair. Gas ranges tend to have the longest lifespan of your major appliances, giving around 15 years of use. Electric ranges on the other hand, are closer to 13 years, which is also the expected lifespan for standard refrigerators and clothes dryers. Your garbage disposal should give you about 10 years of use, while the dishwasher and microwave will be around nine years. You can expect your electric furnace to last about 15 years, 18 for gas and 20 for oil-burning. Central air systems will live 10 to 15 years on average.
2019 has been a year where we have continued to gain more balance in the real estate market. Inventory levels have increased, days on market are longer, negotiations have opened up, and the constricted multiple-offer market is no longer the norm. It has been comforting to see price appreciation temper and move towards more normal, historical levels. Today’s market certainly seems more sustainable and has provided some great opportunities for both buyers and sellers, especially for those that are both.
Recently, I did an analysis on new phenomenon that has presented itself. This is the presence of a dual market. A dual market is when you have different market conditions within the same overarching real estate market. This duality presents amazing opportunities for sellers who are also buyers, depending on where they want to go.
Two dual markets that I have discovered are the move-up market and the move-out market. The move-up market is when you sell the home you are in and move up to an upgraded home in a higher price point. For example, in Edmonds, WA there are many people who are interested in selling their current home and upgrading to a view home. When I analyzed the statistics in both sections of the Edmonds market it appears that a dual market is presenting itself.
In August, all homes in Edmonds under $1M had an absorption rate of 88% while all homes over a $1M, 16%. Months of inventory based on pending sales under $1M was only one month of available inventory, and over $1M, six months! That is the difference of a seller’s market under $1M to a balanced market teetering on a buyer’s market over $1M. After many solid years of strong appreciation, folks that are looking to cash out the equity on their current home and move it into a view home have the opportunity to move their investment with a sizable down payment and upgrade to the lifestyle they have been dreaming about.
Let’s also not forget to mention today’s interest rates. They are a point lower than they were a year ago, affording buyer’s 10% more buying power. For example, a one-point lower rate on a home priced at $1.2M will now afford a buyer the purchase of a home at $1.32M with the same monthly payment. Couple that with price appreciation tempering and you have a move-up market heyday in the making!
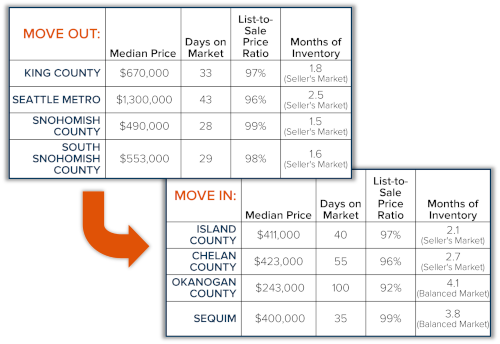
The other dual market that is exciting to witness is the move-out market. This is prevalent for the Baby Boomers looking to cash out on the home that they enjoyed during their working years, typically near job centers, and relocate to an outlying area to retire. The chart below illustrates the market conditions and prices in the urban markets and compares them to the market conditions in some of the most popular retirement destinations in the state, such as Sequim, Island County, Okanogan County, and Chelan County. Note, if there is a destination that is not listed and you would like the statistics, please reach out. I have access to many markets across the state and beyond. Also, I am a part of an agent network that I can access to put you in touch with capable experts across or out of the state to help educate and serve your real estate needs with these markets.
The previous, hard-core seller’s market we experienced was quite the ride and built up some pretty major equity gains for homeowners across the board. It was exciting, but these more normal conditions are more pliable and comfortable. They allow for moves that don’t require physically moving twice, high price escalations, or constantly getting beat out by other buyers to succeed. Overall, there is just more breathing room. Are there homes that get multiple offers, yes! Homes that are expertly brought to market with thoughtful pricing and dialed-in preparation are having fun with their results. Opportunities abound for both buyers and sellers, and in a market with more options it is important to align with an agent that can help navigate all the choices.
If you are curious about the opportunities these dual markets present, please reach out. It is my goal to help keep my clients educated and empowered to make strong decisions. This is especially rewarding when it leads to their next chapter in life, which are amazing transitions to be a part of. Stay tuned for next month’s newsletter, when I will feature opportunities in the condominium market and how this duality is starting to take shape.
Nothing feels more like fall than pumpkin picking, hay rides and corn mazes. Get your latte in hand and head out to any one of these great, local farms to have some harvest fun and find that perfect jack-o-lantern to light up your porch.
We all know that nothing lasts forever, but when everything is working fine it is easy to forget that all of the systems and appliances in your home have a finite lifespan. Keep this information in mind, whether you are buying or selling a home, budgeting for improvements, or deciding between repairing and replacing.
ROOFING, SIDING, WINDOWS & DECKS. You can expect slate or tile roofs to last around 50 years, wood shingles 25-30, metal will get you about 25 years, while asphalts typically last about 20 years. The lifespan for siding can vary quite a bit. Brick will last 100 years or more, aluminum about 80 years and stucco will probably last you 25 years. Wood siding can last anywhere from 10 to 100 years depending on the climate you live in and how it is maintained. Both aluminum and vinyl windows will last 15 to 20 years, while unclad wood windows can have a life of 30 years or more. Cedar decks will average 15-25 years as long as they are properly treated and cleaned, and a high quality composite deck will last 30 years with minimal maintenance.
FLOORING. The natural flooring materials such as wood, marble, slate or granite will all last 100 years or more, while tile has an average life of 70-100 years. Vinyl can last up to 50 years, while laminate and linoleum will get you up to 25 years. Expect your carpet to last 8-10 years, depending on use.
KITCHEN & BATH. Laminate countertops can have a life of 20 years or more, but it will vary depending on use. Wood, tile and stone should last a lifetime, and cultured marble will typically see a lifespan of 20 years. You can expect your stainless steel sink to last you about 30 years, while an enamel-coated sink will give you five to 10 years. Slate, granite, soapstone and copper will be around for 100 years or more. Bathroom faucets should give you about 20 years, and toilets will average a 50-year lifespan, although some of the parts will need replacing.
APPLIANCES. The lifespan of appliances will vary widely depending on the appliance, the brand, model, and use. Use these average lifespan numbers as a rough guide for when it may make more sense to replace rather than repair. Gas ranges tend to have the longest lifespan of your major appliances, giving around 15 years of use. Electric ranges on the other hand, are closer to 13 years, which is also the expected lifespan for standard refrigerators and clothes dryers. Your garbage disposal should give you about 10 years of use, while the dishwasher and microwave will be around nine years. You can expect your electric furnace to last about 15 years, 18 for gas and 20 for oil-burning. Central air systems will live 10 to 15 years on average.

 Facebook
 X
X
 Pinterest
 Copy Link


 Increased pending activity is an indication of strong buyer demand which is very much being driven by historically low interest rates, a thriving job market, and an overall strong local economy. In fact, interest rates are an entire point lower than they were a year ago! This affords buyers a price point that is 10% higher over last year while maintaining the same monthly payment. A year ago, the monthly payment for a home at $900,000 is the same for a home at $990,000 today. Today’s rates coupled with tempered price appreciation provides increased affordability for buyers, which in turn is providing a healthy audience for sellers. After many years of strong price increases, many sellers are moving their equity to the next lifestyle home they desire.
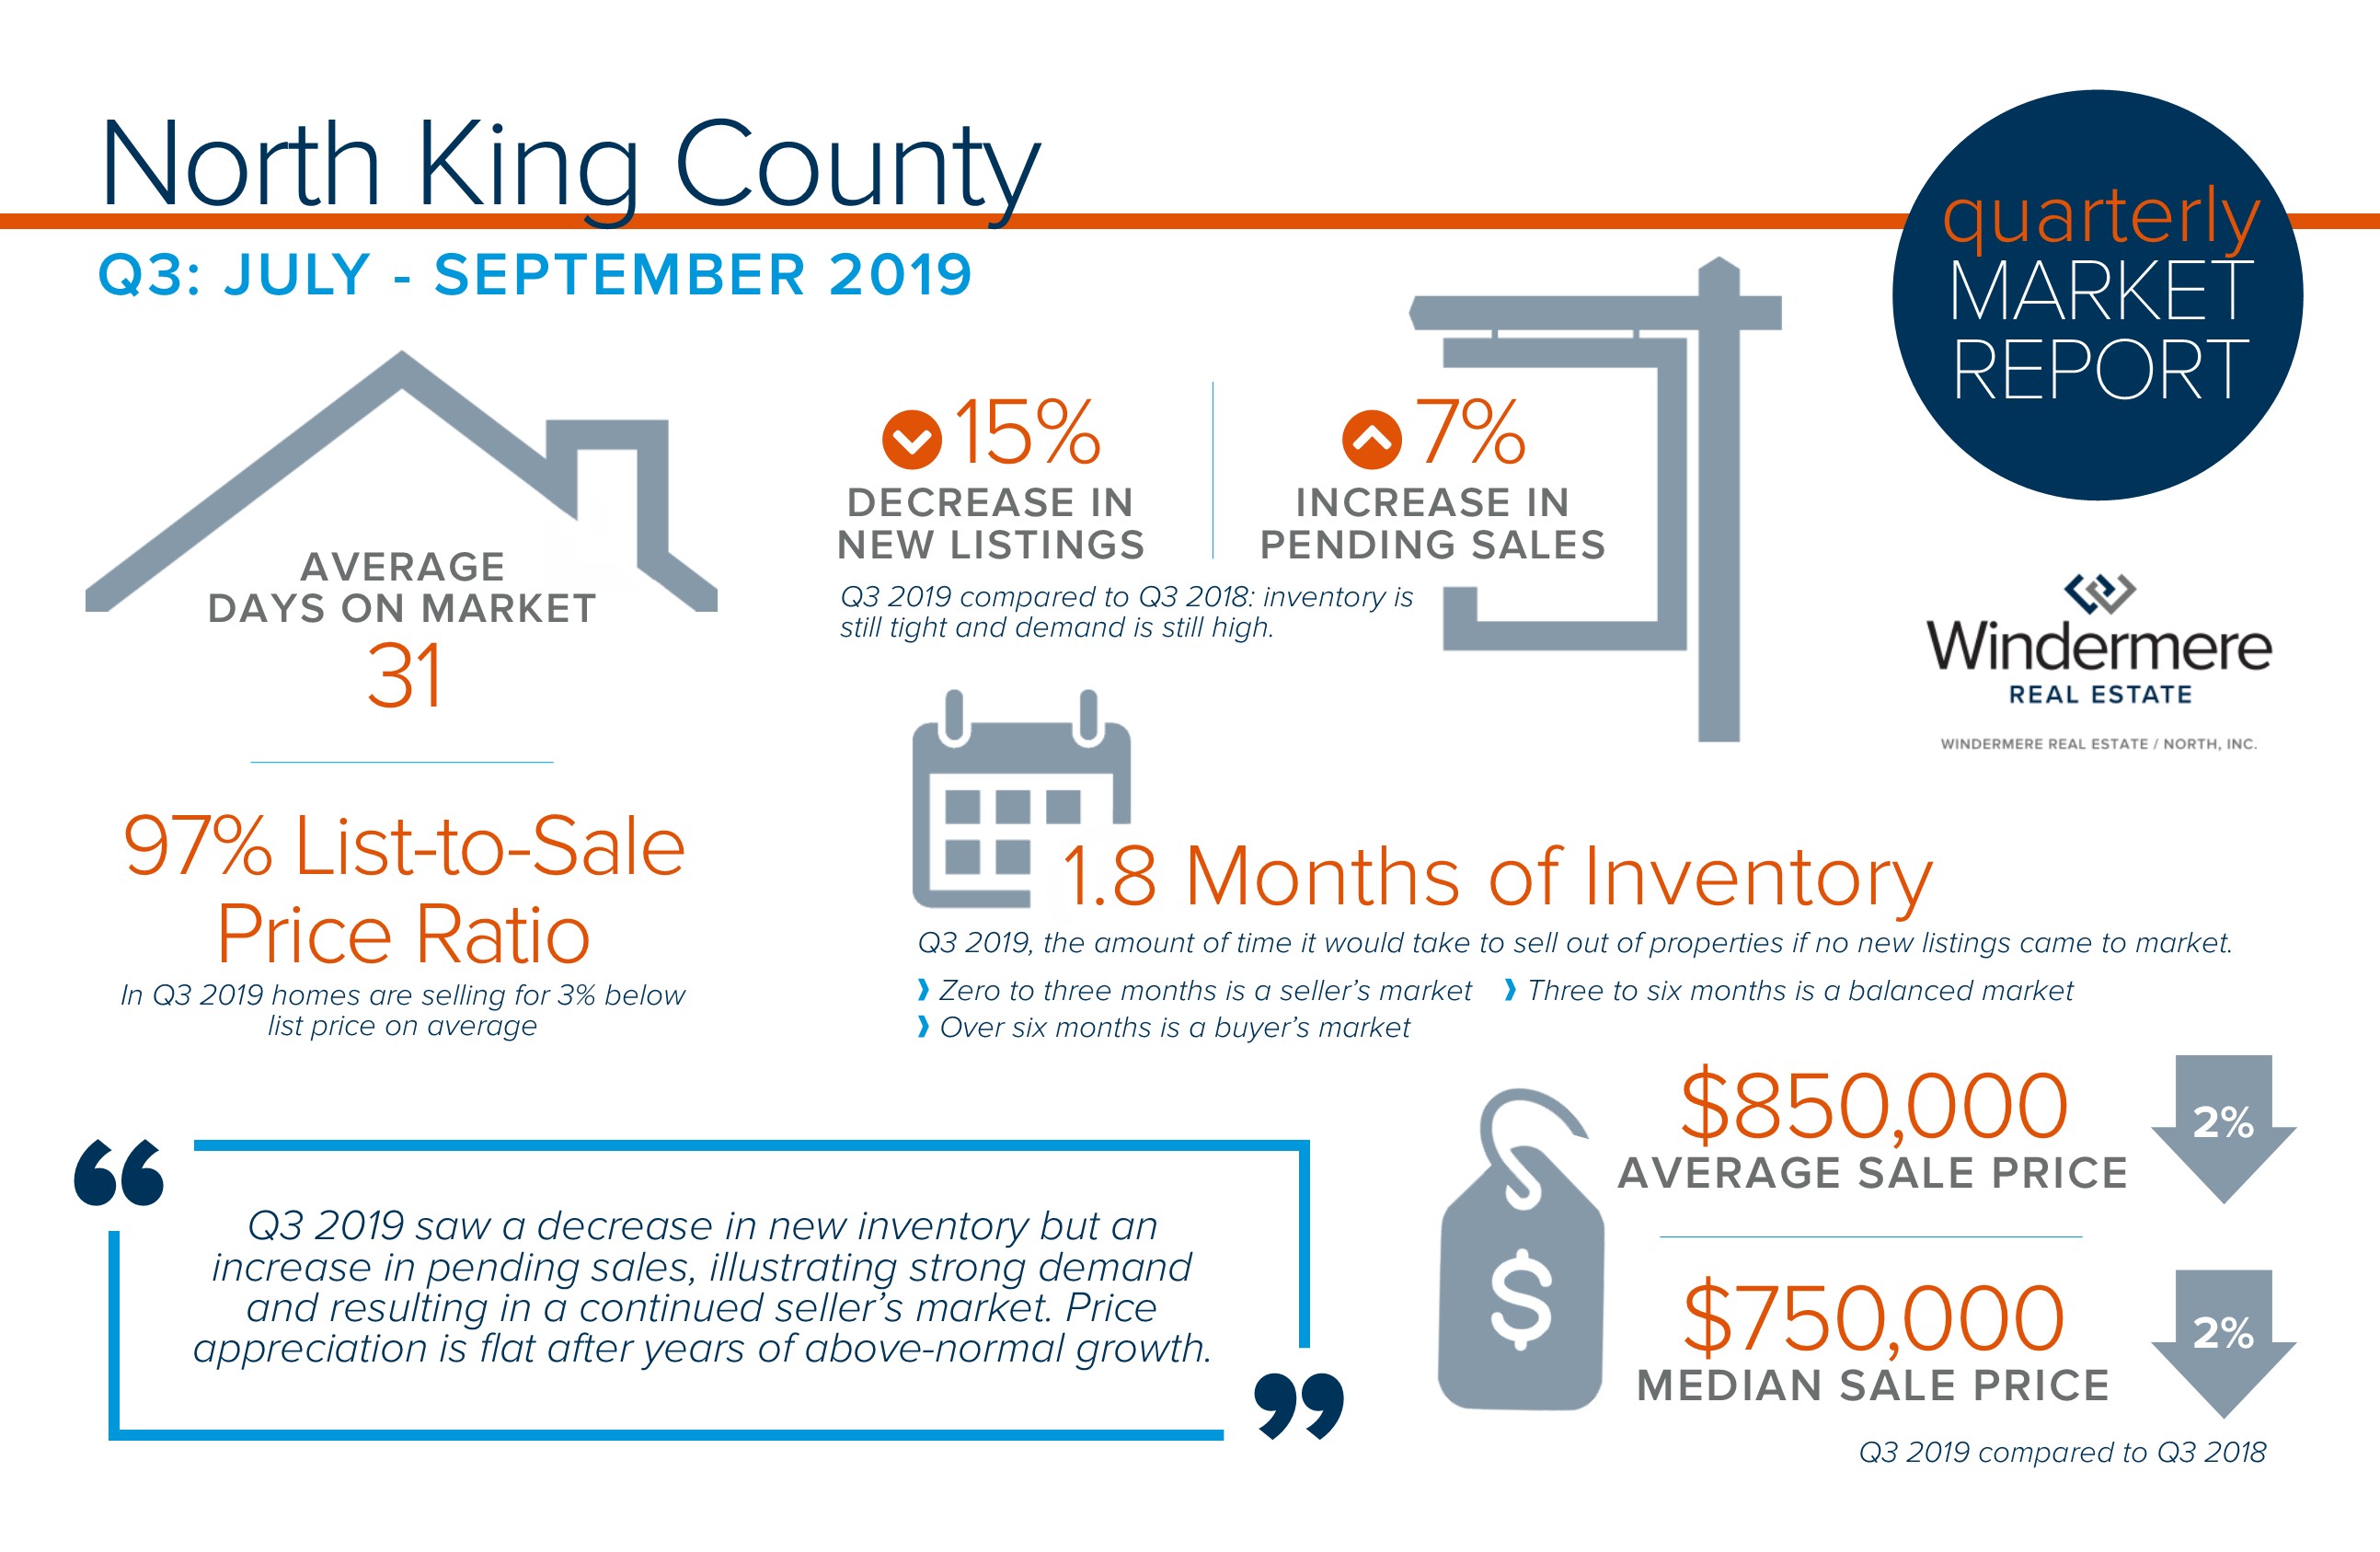
 Increased pending activity is an indication of strong buyer demand which is very much being driven by historically low interest rates, a thriving job market, and an overall strong local economy. In fact, interest rates are an entire point lower than they were a year ago! This affords buyers a price point that is 10% higher over last year while maintaining the same monthly payment. A year ago, the monthly payment for a home at $750,000 is the same for a home at $825,000 today. Today’s rates coupled with tempered price appreciation provides increased affordability for buyers, which in turn is providing a healthy audience for sellers. After many years of strong price increases, many sellers are moving their equity to the next lifestyle home they desire.
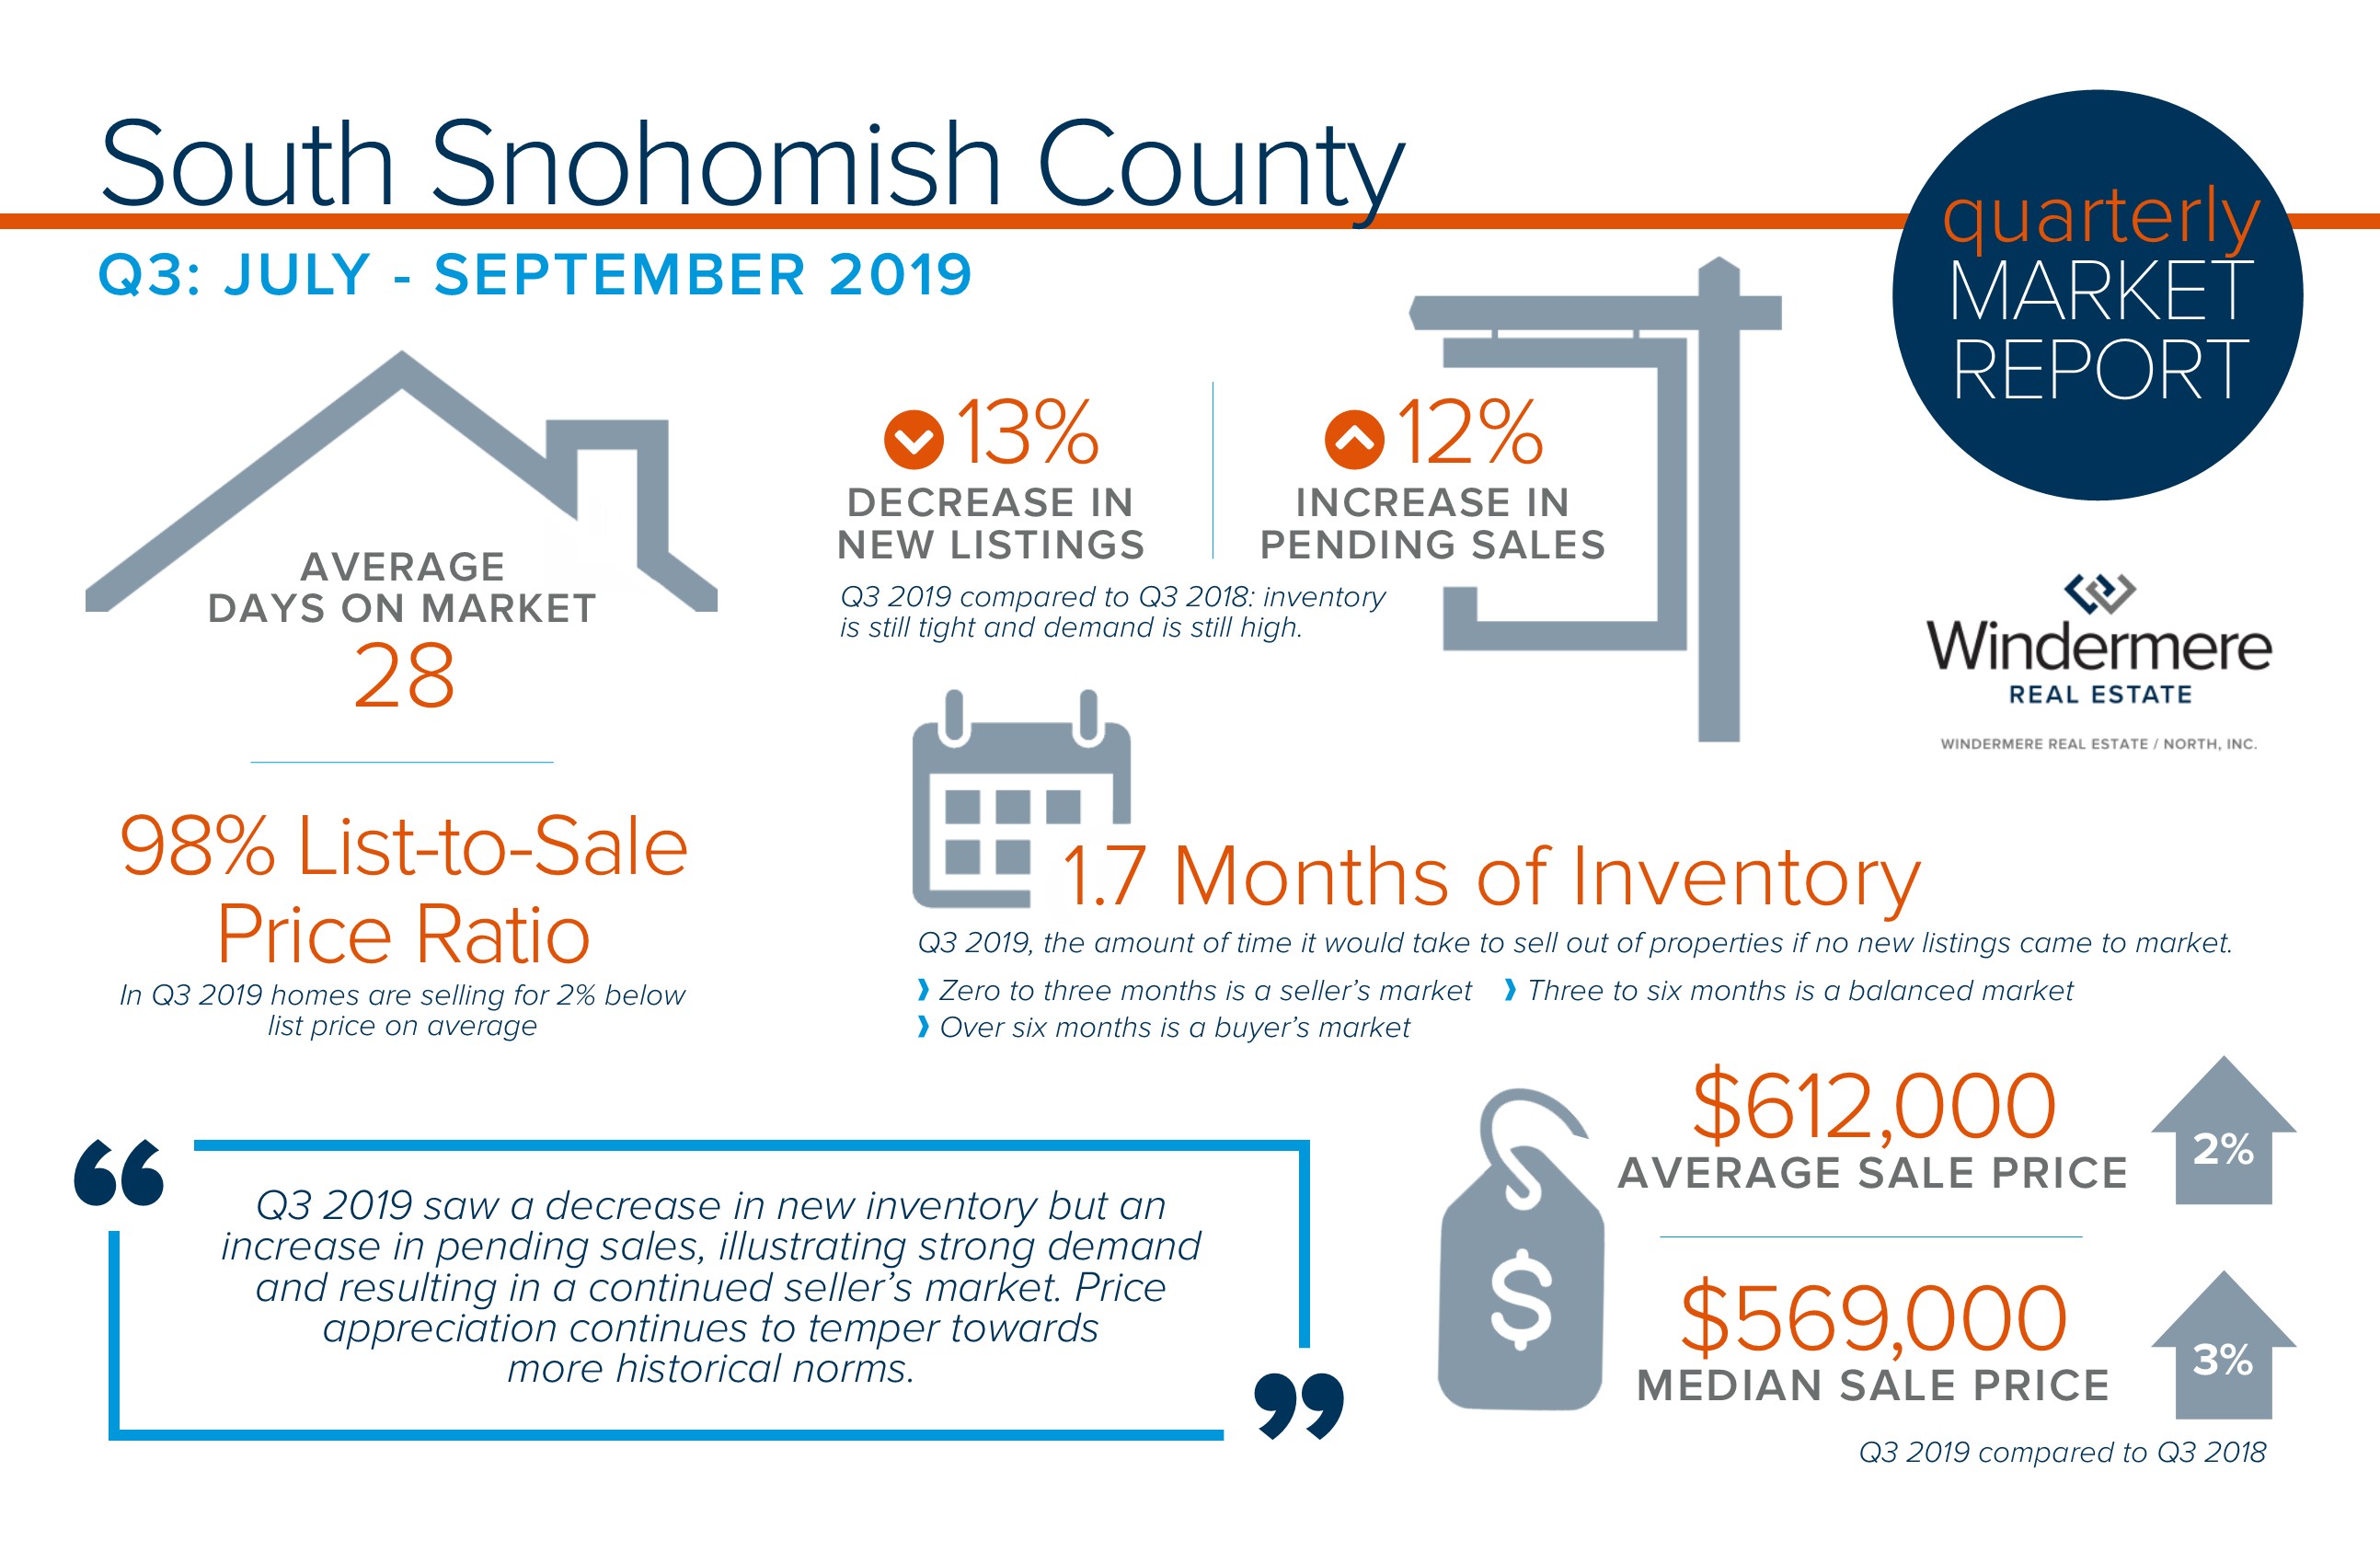
 Increased pending activity is an indication of strong buyer demand which is very much being driven by historically low interest rates, a thriving job market, and an overall strong local economy. In fact, interest rates are an entire point lower than they were a year ago! This affords buyers a price point that is 10% higher over last year while maintaining the same monthly payment. A year ago, the monthly payment for a home at $550,000 is the same for a home at $605,000 today. Today’s rates coupled with tempered price appreciation provides increased affordability for buyers, which in turn is providing a healthy audience for sellers. After many years of strong price increases, many sellers are moving their equity to the next lifestyle home they desire.
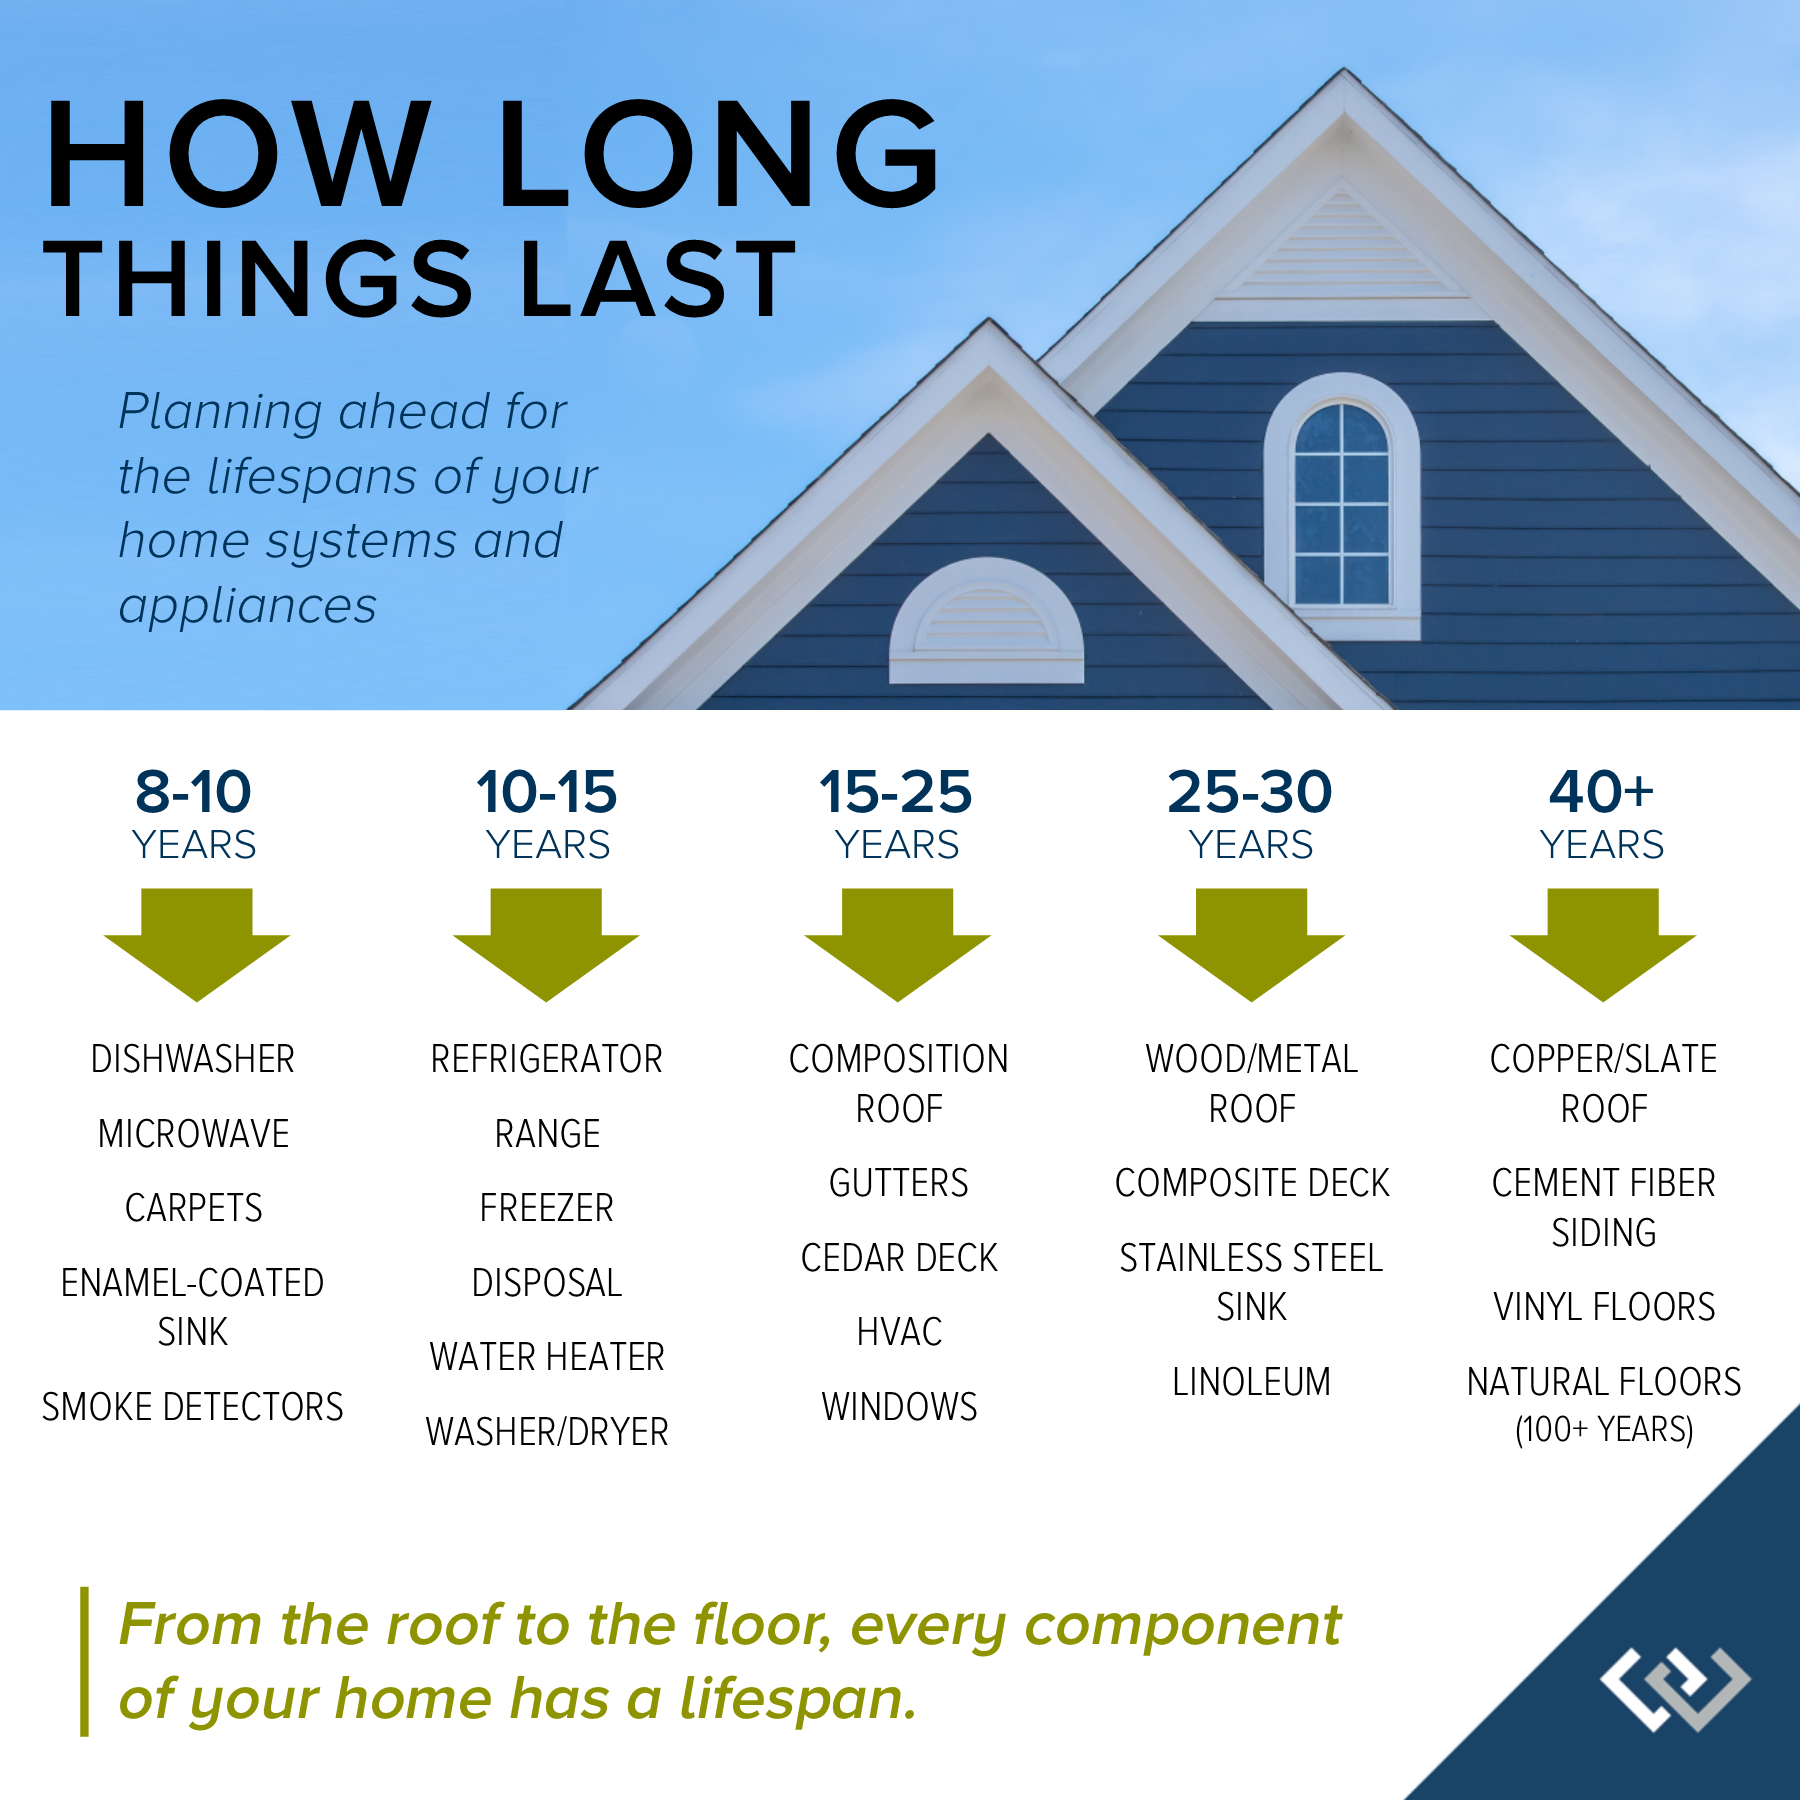


 The previous, hard-core seller’s market we experienced was quite the ride and built up some pretty major equity gains for homeowners across the board. It was exciting, but these more normal conditions are more pliable and comfortable. They allow for moves that don’t require physically moving twice, high price escalations, or constantly getting beat out by other buyers to succeed. Overall, there is just more breathing room. Are there homes that get multiple offers, yes! Homes that are expertly brought to market with thoughtful pricing and dialed-in preparation are having fun with their results. Opportunities abound for both buyers and sellers, and in a market with more options it is important to align with an agent that can help navigate all the choices.